

Datadog is one of the most popular tools for monitoring performance, infrastructure, and security. However, many organizations are actively exploring alternatives due to their high pricing and feature limitations. Additionally, they seek simpler, more customizable solutions that better fit their needs.
What is Datadog?
Datadog is a cloud-based monitoring and analytics tool used by tech teams to track the health, performance, and security of applications and infrastructure. Specifically, companies use Datadog to monitor performance, detect problems early, and optimize their systems.
In application monitoring, for instance, it ensures software runs efficiently with minimal downtime by tracking performance metrics and identifying bottlenecks. Furthermore, for cloud monitoring, it excels at tracking resources across major cloud providers like AWS, GCP, and Azure. As a result, Datadog provides unified visibility into cloud infrastructure.
Why Teams Are Seeking Alternatives
Overall, Datadog offers a robust platform for infrastructure monitoring. That said, it does have some significant drawbacks. First, the setup process can be quite complex, particularly for smaller teams without dedicated DevOps resources. Additionally, pricing often escalates quickly, which particularly challenges small and medium-sized companies.
Therefore, in this article, we explore ten affordable Datadog alternatives available today. Moreover, we’ll be highlighting their strengths, ideal use cases, and what makes them stand out in the competitive monitoring landscape.
What To Look For In a Datadog Alternative
When searching for an alternative cloud monitoring tool, prioritise the factors that matter most to your business.
- Full-Stack Observability: A strong alternative should collect and correlate metrics, logs, and traces, while also monitoring real users, running synthetic tests, and providing security and network visibility.
- Integration Needs: Choose a platform that pairs smoothly with your current cloud providers (AWS, Azure, GCP), containers (K8S), languages, and databases.
- Reliability and Support: A budget-friendly option shouldn’t mean poor support. Look for providers that offer reliable, strong vendor or community support.
- Security and Compliance: Pick a tool that clearly outlines its approach to encryption, data privacy, and compliance.
- Root Cause Analysis and Automation: A good alternative should help you quickly identify and fix issues. By automatically mapping services and detecting anomalies using AI/ML.
Top 10 Datadog Alternatives
1. New Relic
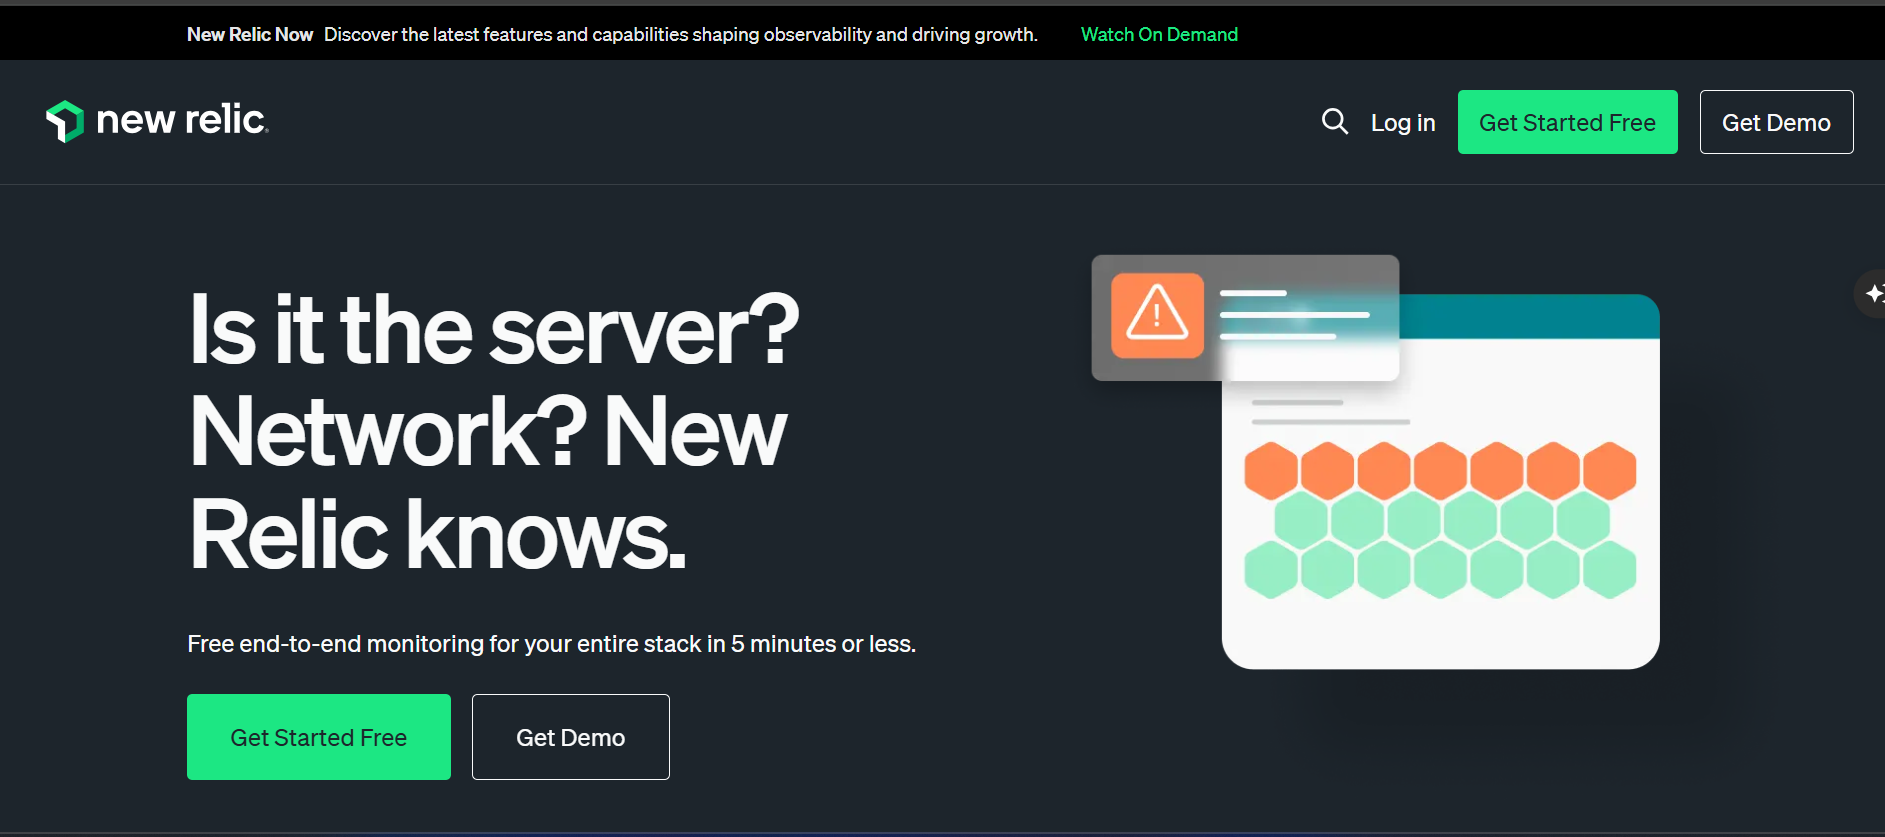
New Relic is a mature, full-stack observability platform. Specifically, it supports APM, infrastructure monitoring, logs, distributed tracing, error tracking, synthetic and real‑user monitoring, and AI insights.
Features
- Offers 700+ integrations, including AI insights and reporting.
- Use error tracking and alerts to identify problems, visualise dependencies, and instantly monitor golden metrics.
- Provides full-stack analysis that covers infrastructure, application performance, and user experience.
- It leverages artificial intelligence and predictive analysis, thereby identifying potential issues before they occur.
Pros
- Very generous free tier: 100 GB data ingest per month
- Usage-based model for data ingest + users, meaning no need to pay per host
- Rich features and capabilities: specifically, 50+ tools/capabilities in a single platform
- Furthermore, it offers strong query, dashboarding, and analysis tools
Cons
- The UI and feature set are extensive, which can be overwhelming for new users.
- Resource-intensive agents in certain environments can impact performance.
- Cost can escalate with high ingestion or a large number of users.
Pricing
- Free tier: 100GB/month of data and unlimited basic users.
- Standard: For growing teams with up to 5 full platform users.
- Pro: No user limits and faster customer support.
- Enterprise: All the advanced features plus top-tier security compliance.
Best For
Ideal for enterprise business and application performance monitoring.
Why It’s an Affordable Alternative
New Relic offers a simplified setup, automatic log collection, and focuses on easy visualisation. Also, it offers a generous free tier, hence reducing both complexity and costs compared to Datadog.
2. Dynatrace
Dynatrace is a Datadog alternative that offers full-stack monitoring (apps, infrastructure, containers), automatic service discovery and mapping, real-time root-cause analysis (AI-driven), code-level profiling, distributed tracing, and APM.
Features
- Combines generative, causal, and predictive AI to automate processes.
- Automatic map application and infrastructure dependencies in real-time.
- Out-of-the-box support for AIOps, DevSecOps, cloud migration, and full-stack observability.
- Enterprise-grade security.
Pros
- AI-powered anomaly detection and root-cause analysis reduce the need for manual investigation.
- Auto-discovery of dependencies via its topology mapping.
- Very detailed tracing (PurePath) lets you look at user transactions from front to back.
- Broad observability: infrastructure, Kubernetes, code, logs, and user sessions.
Cons
- Complex setup and configuration, especially for large environments.
- Unclear pricing, especially for smaller teams..
Pricing
- Full-Stack Monitoring: $0.08 per hour for 8 GiB host
- Infrastructure Monitoring: $0.04 per hour for any size host.
- Kubernetes Platform Monitoring: $0.002 per hour for any size pod.
- Application Security: $0.018 per hour for an 8 GiB host.
- Real User Monitoring: $0.00225 per session.
- Synthetic Monitoring: $0.001 per synthetic request.
- Log Management & Analytics:
- Ingest & Process: $0.20 per GiB.
- Retain with Included Queries: $0.02 per GiB-day (10 to 35-day retention).
Best For
Teams that work in a complex environment need AI-powered analytics.
Why It’s an Affordable Alternative
Dynatrace stands out as a better alternative to Datadog because it’s AI automatically analyses your entire stack, pinpoints root causes, and handles issues intelligently. Whereas Datadog’s Watchdog requires manual monitoring setup and lacks comprehensive dependency mapping.
3. Splunk Observability
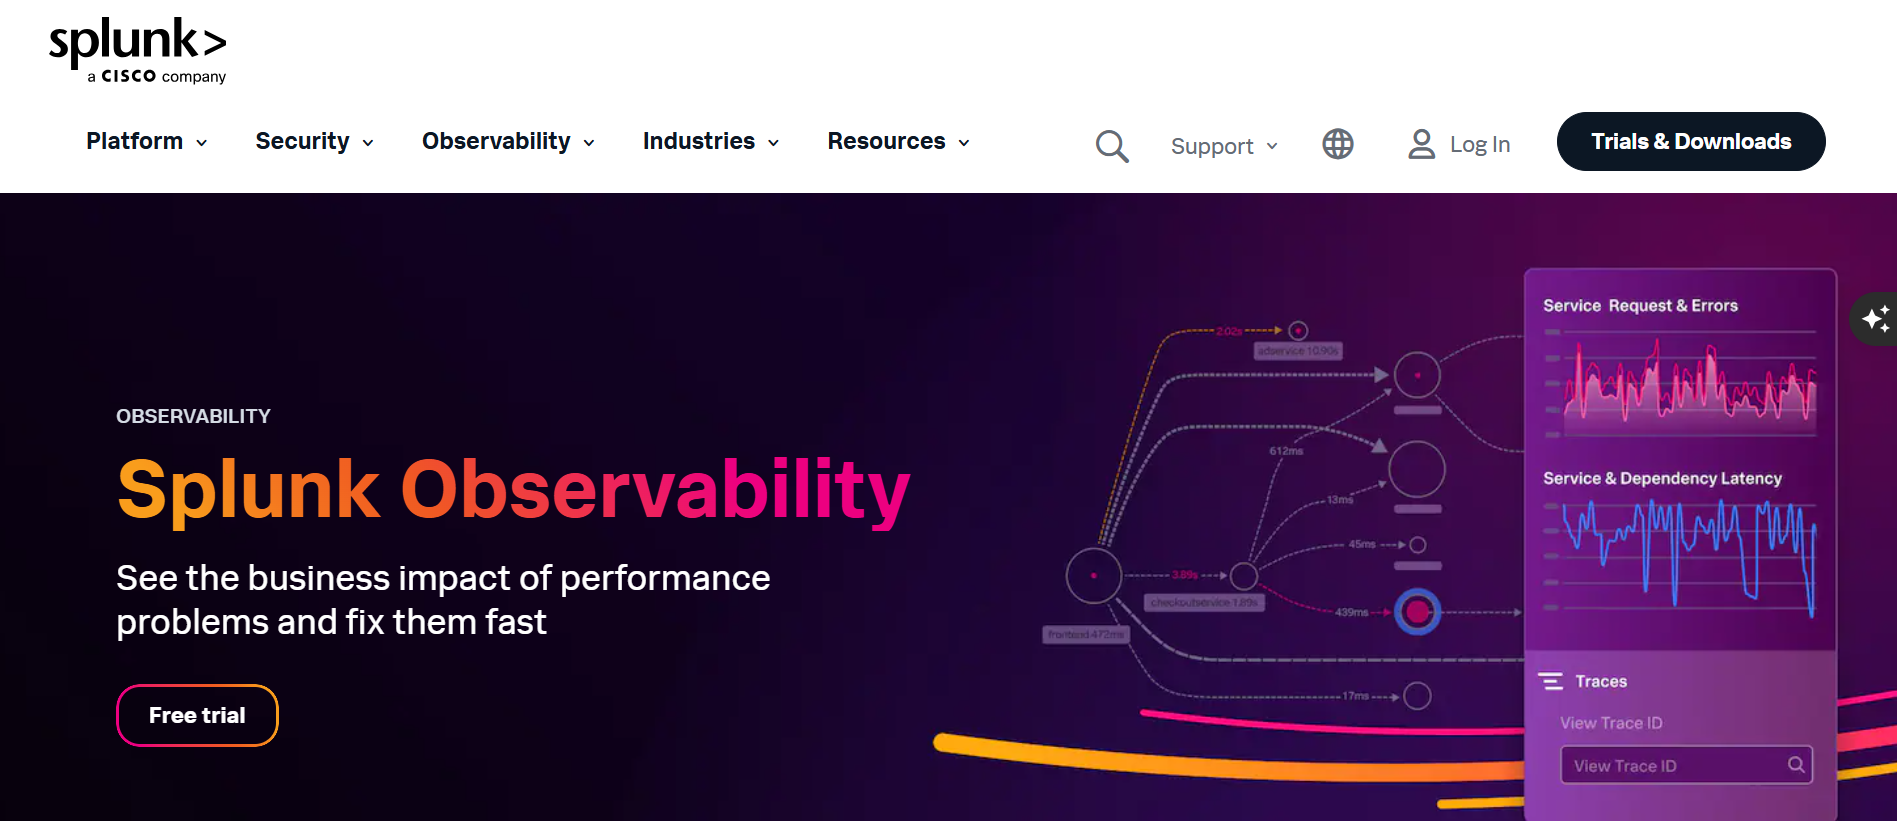
Splunk Observability offers a unified platform combining metrics, traces, and logs with security analytics. It bridges the gap between DevOps and security teams with powerful correlation capabilities. The platform also provides real-time analytics, real-time event correlation, infrastructure monitoring, APM, and synthetic monitoring.
Features
- Flexible data ingestion with pay-as-you-go model, optimizing operational costs.
- Integrates with the Splunk Cloud Platform, enabling contextual log analysis alongside observability data.
- AI-powered insights and shared workflows help reduce mean time to resolution (MTTR) across complex environments.
- Combines logs, traces, and metrics to give engineering and IT teams full digital insight.
Pros
- Combines observability with cybersecurity.
- Provides wide integration support and real-time event correlation.
- Scalable for large enterprises.
Cons
- Pricing can get very high: per-host model + add-ons.
- long retention or big data volumes may significantly increase costs.
- The query language (SPL) and dashboards may be difficult for newer teams.
Pricing
- Starts at $15/month per host.
- You pay extra for features like synthetic monitoring, log retention, etc.
Best For
Large enterprises or organisations with high telemetry volumes, complex infrastructures, and on‑call/incident management needs.
Why It’s an Affordable Alternative
Splunk provides robust event correlation and predictive analytics, which can help reduce incident resolution time and save operational costs. However, it may not always be cheaper in raw ingestion cost, but the value comes from advanced analytics and mature tooling.
4. Coralogix
Coralogix is a cloud-native log analytics platform focused on cost optimization and real-time insights. In particular, this budget-friendly alternative for startups uses machine learning to slash logging costs without sacrificing usability.
Features
- Spot trends in error rates or API latency.
- Pre-built reports for audits
- Stream logs with sub-second latency.
Pros
- Designed to reduce ingestion/index costs
- Good for teams that need to ingest a lot of logs/traces while controlling spend.
Cons
- Limited custom dashboard options
- Focus is stronger on logs/stream analytics
Pricing
- For Logs: $0.52/GB
- For Traces: $0.44/GB
- For Metrics: $0.05/GB
Best For
DevOps teams prioritising log cost reduction and SaaS startups scaling on AWS/GCP.
Why It’s an Affordable Alternative
Coralogix’s ML-based tiered storage automatically archives low-value logs to S3, thereby reducing bills by 60-70%. Furthermore, its new Edge SDK now supports Rust and WebAssembly for IoT devices, making it even more versatile.
5. Netdata
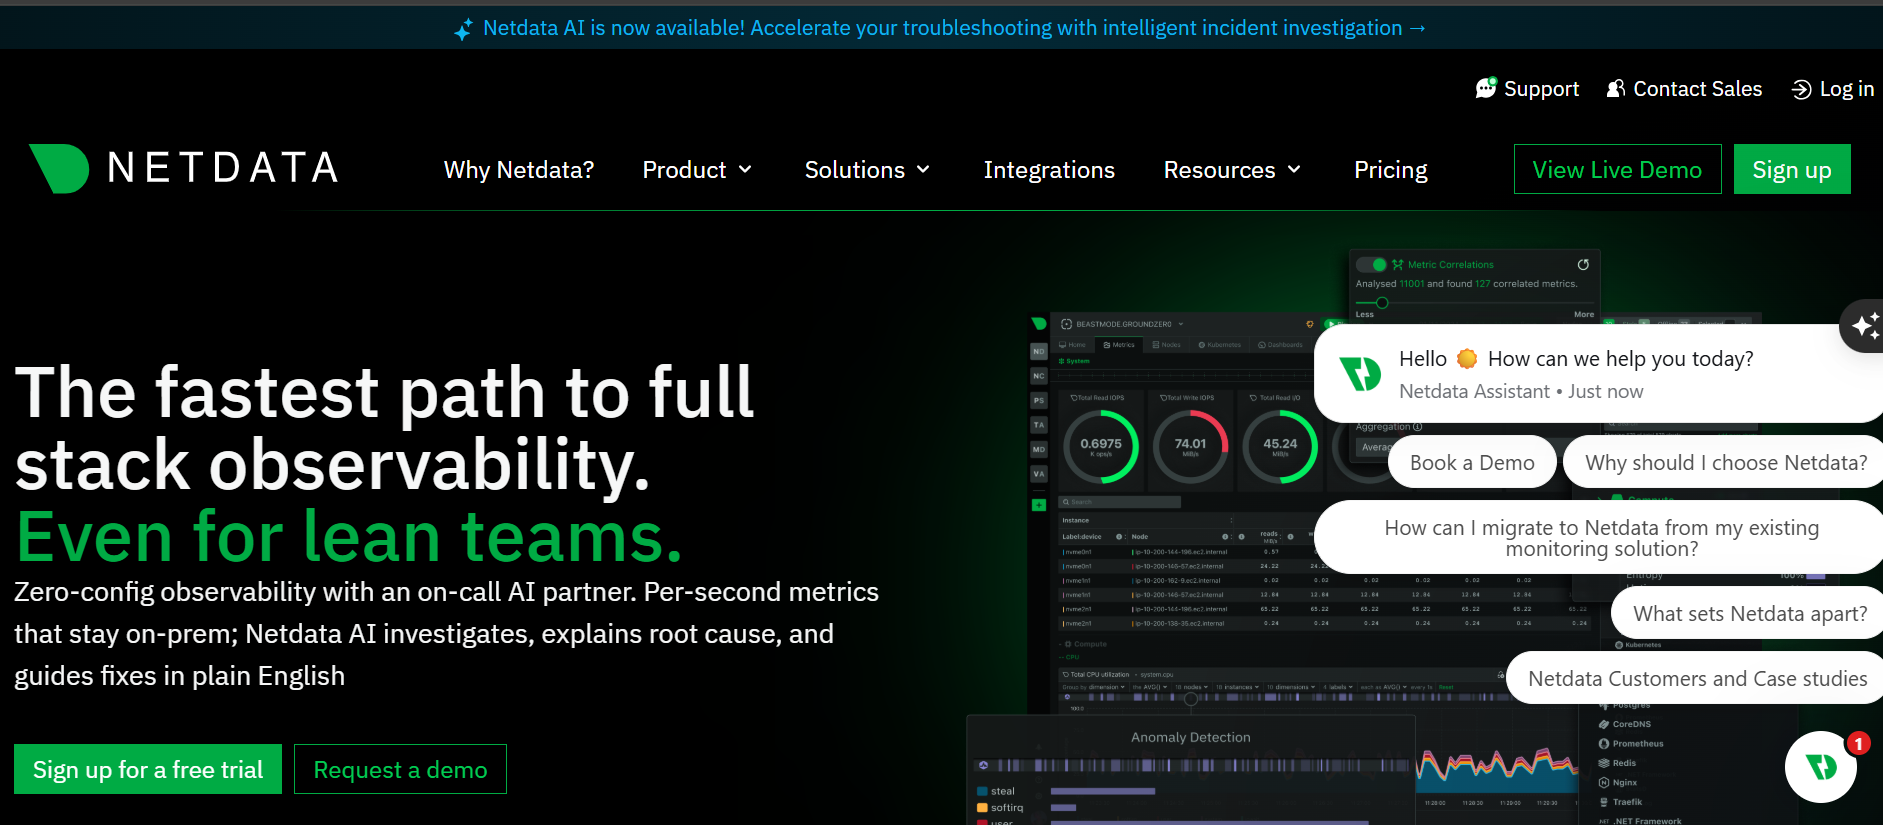
Netdata provides real-time infrastructure monitoring with a focus on simplicity. The instant visibility solution it auto-discovers every service, container, and cloud resource in minutes.
Features
- Automatic detection and discovery
- Per-second data collection and processing
- Rich, interactive dashboards
- Unsupervised anomaly detection
Pros
- Offers immediate deployment without complex set-up.
- low per-node pricing for business tiers. G2+1
- Ability to monitor resource usage and maximum scalability.
Cons
- Netdata may struggle in very large or highly dynamic distributed systems with hundreds of containers or VMs.
- Insufficient documentation for less technical audiences.
- Customizing alerts and dashboards can be unintuitive and time-consuming without templates.
Pricing
- Free: Max 5 active connected nodes
- Business: $4.50/node per month
- Homelab: $10 per month
- Enterprise on-premise: Custom pricing (starts at 200 nodes, approx. $4.22/node/mo).
Why It’s an Affordable Alternative
Compared to Datadog, Netdata’s free tier and very low per-node costs for paid tiers make it ideal for situations where you need immediate, real-time visibility without heavy licensing fees.
6. Better Stack Telemetry
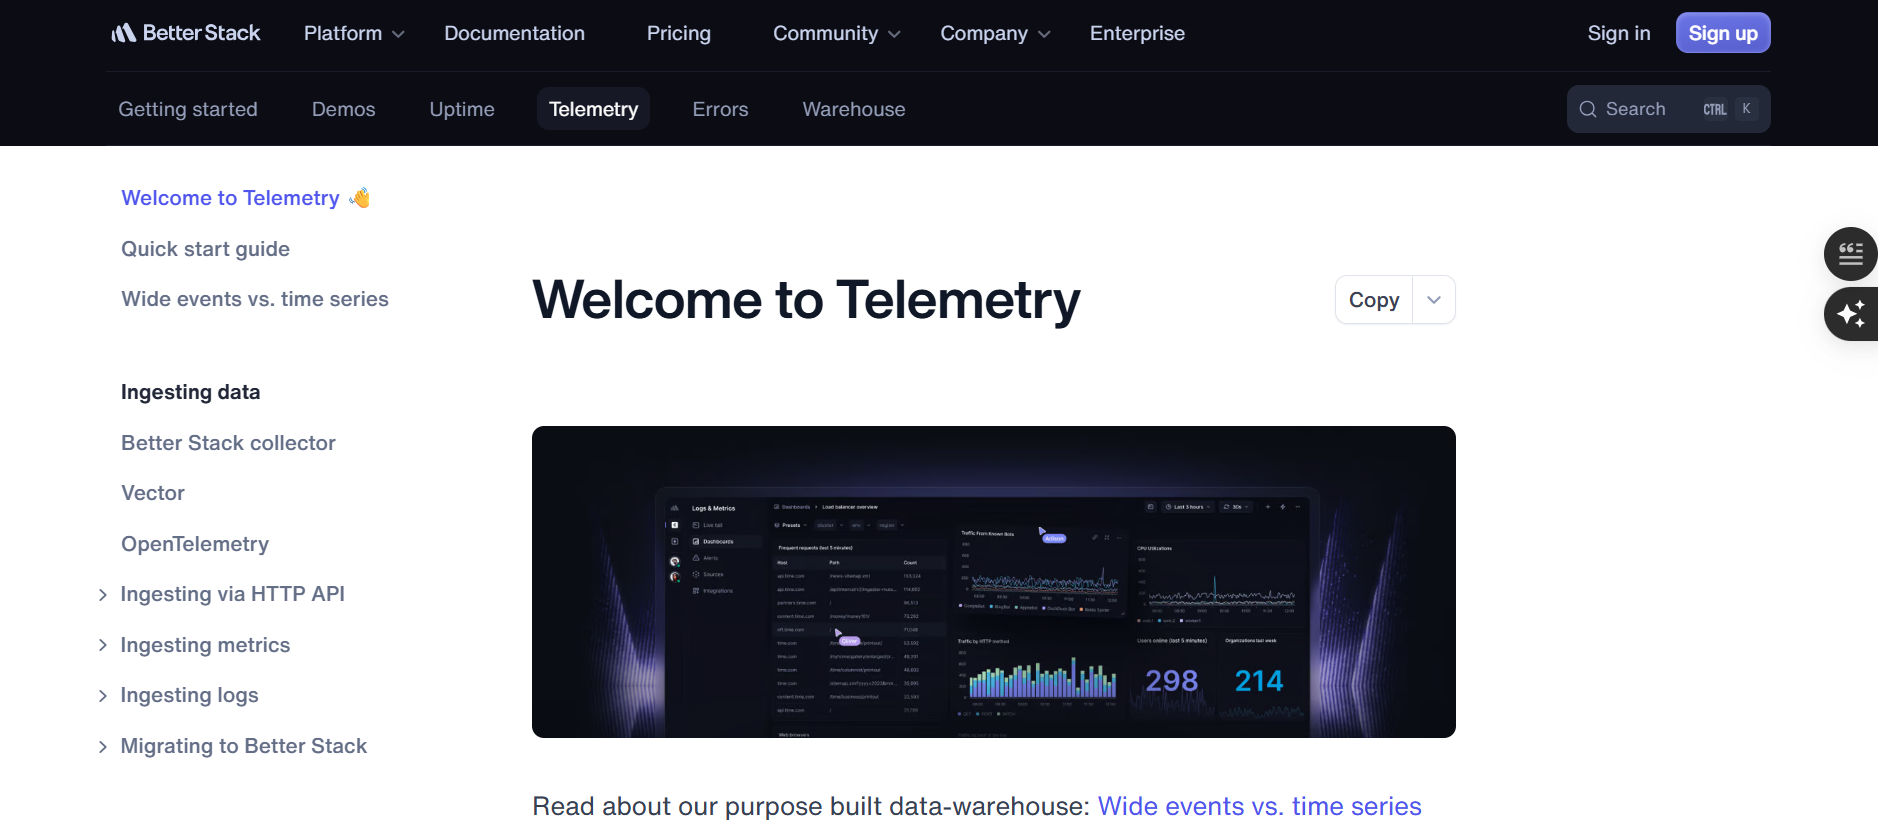
Better Stack Telemetry (formerly logtail) is a powerful, cost-efficient alternative to Datadog, especially for teams that generate a lot of logs, run cloud-native apps, and want to unify observability and incident management without paying huge ingestion or licensing fees.
This tool is SQL compatible, allowing you to create custom reports by writing SQL queries and save them as dashboards for your team. You can also create alerts based on log volume and configure notifications when Better Stack receives too many or insufficient log records.
Features
- Custom retention lets you set log-specific retention policies, so you keep only what you need without archiving everything to cold storage
- Built-in on-call scheduling, escalation policies, Slack-based workflows, and smart incident merging
- Compatible with Sentry SDKs, and integrates deeply with its incident workflows.
- Serverless ClickHouse API for analytics; you can query your data via SQL, store in your own S3, and avoid vendor lock-in
- Integrates with Google Calendar for easy scheduling.
Pros
- It’s cheaper to ingest and store telemetry than many legacy vendors.
- Competitive pricing with different plans for various team sizes
- Supports high log volumes, structured data, and includes compliance features (GDPR, SOC 2)
- Built-in incidence response
- Uses eBPF and OpenTelemetry, so you can get deep insights (traces, metrics)
Cons
- Not a complete Datadog replacement; some advanced enterprise features may be missing
- Non-SQL users may need time to build complex queries.
- Relies on Better Stack’s infrastructure, unlike self-hosted open-source tools.
- Some advanced features or niche integrations may be less mature.
Pricing
- Free tier: 3 GB logs (3-day retention) and 10 monitors.
- Paid: Starts at $25/month, with log ingestion around $0.45/GB.
Best For:
Better Stack Telemetry is ideal for Startups & Growing Teams. Especially those looking to replace Datadog because of its high cost, Better Stack offers powerful observability at a lower price.
Why It’s an Affordable Alternative
Compared to Datadog, Better Stacks’ architecture (ClickHouse + efficient data ingestion) enables high throughput at a fraction of what Datadog might charge for similar data volume.
7. SigNoz
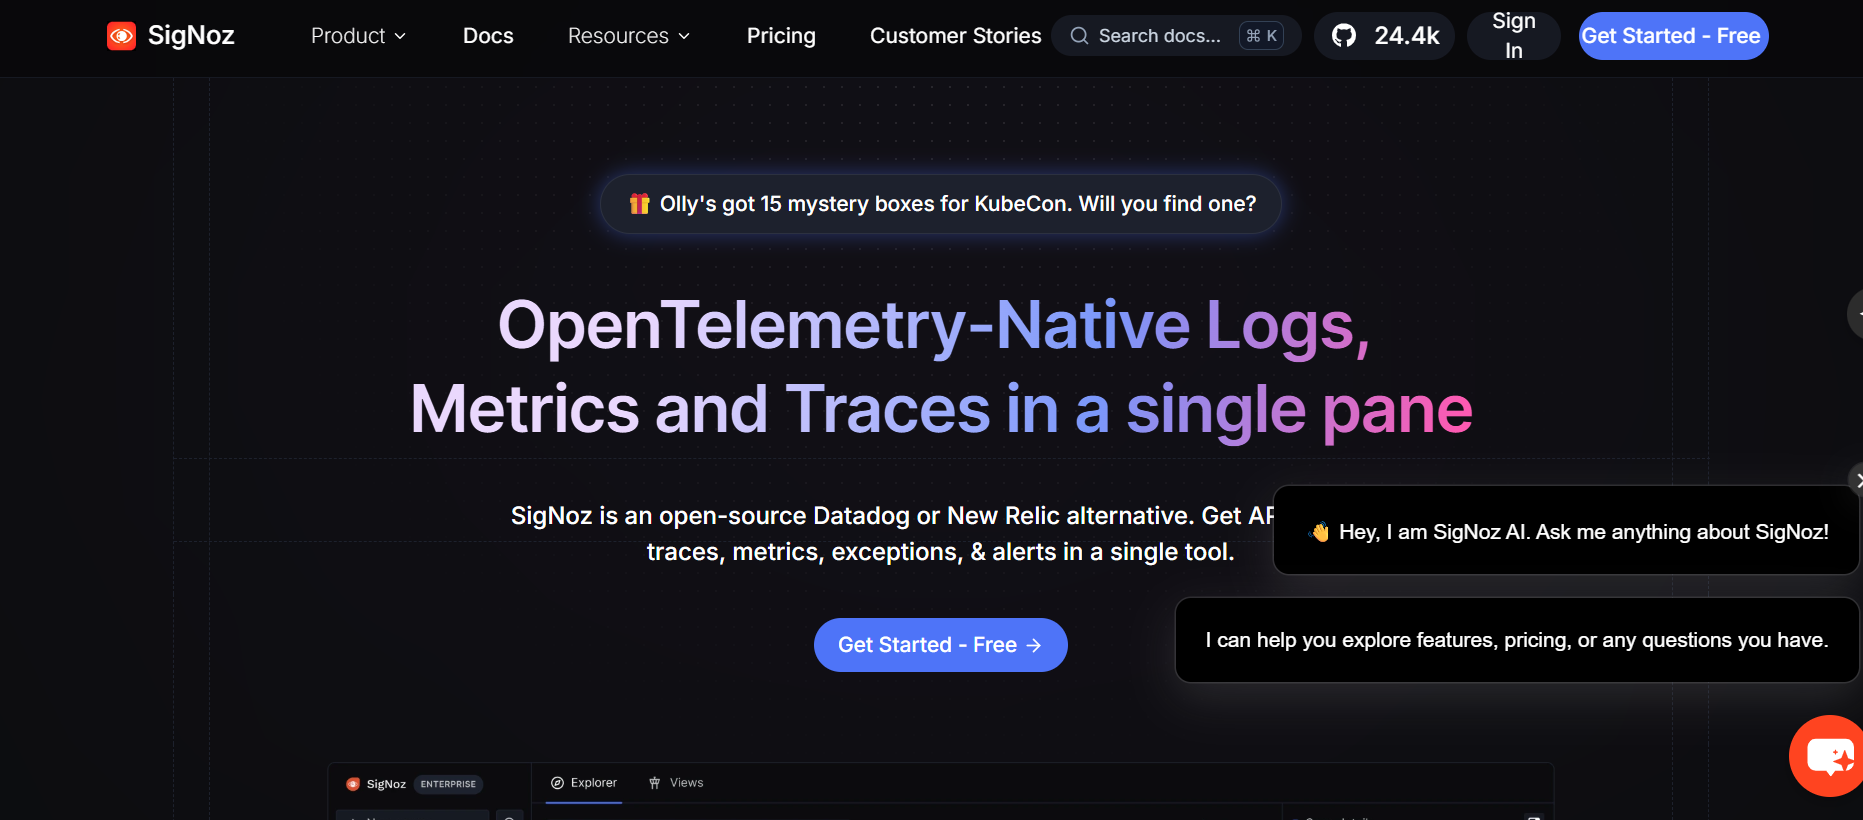
SigNoz stands out as a highly cost‑effective, developer-friendly alternative to Datadog because it combines all three observability signals (metrics, logs, traces) in one platform. This tool is OpenTelemetry-native and uses a straightforward, usage-based billing model with no host or user licensing fees.
Features
- Supports any language/framework that emits OTLP data.
- Allows you to ingest, parse, query, and live-tail logs.
- Provides tracing with detailed visibility, including flame graphs to analyze span duration
- Supports monitoring of external HTTP APIs (like Stripe, Twilio) with error rates, latency, and status codes, all correlated with traces
- Create custom dashboards and set alerts based on metrics or trace-based conditions
Pros
- Unlimited hosts and no per-user billing. You can give access to your whole team without extra cost.
- Self-hosted edition gives you full control over data retention, sampling, and infrastructure.
- According to SigNoz’s own analysis, it provides “up to 9× more value for money” than Datadog.
- Ingestion-based pricing is simpler and more predictable than Datadog’s complex SKU‑based mode.
Cons
- Running SigNoz yourself means managing infrastructure, ClickHouse (for storage), and OpenTelemetry pipelines.
- Smaller integration system and community compared to legacy players.
- Risk of dropping data if you exceed the ingestion limit on a paid cloud plan.
Pricing
- Community Edition: Free, self-hosted
- Cloud (Teams): Starts at $49/month for a base usage allotment.
- Enterprise (Cloud / Self-Hosted): Custom pricing starts at $4,000/month.
Best For
SigNoz is best suited for teams that want full observability but need to manage costs carefully. Especially those using modern cloud-native stacks (microservices, Kubernetes) and already using or willing to adopt OpenTelemetry.
Why It’s an Affordable Alternative
For teams that want observability power without breaking the bank, or for organisations that want to avoid vendor lock-in, SigNoz is a compelling choice. Even if you self-host, the operational overhead is often outweighed by the long-term savings and control.
8. AppSignal
AppSignal monitors your application wiith intuitive tools that instantly give you the insights you need to make proactive monitoring decisions. It is an all-in-one monitoring toolkit for teams and apps of all shapes and sizes. Track errors, monitor performance, manage logs, and much more, all from one simple interface.
Features
- Track errors across deployments and be notified when they occur.
- Monitor the performance of your app and gain insights into underperforming code and requests.
- Manage all your application logs in one simple interface and move effortlessly between log lines
- Visually track all your core and custom metrics with custom graphs and dashboards.
- AppSignal emphasizes developer‑friendly, direct support
Pros
- AppSignal offers transparent pricing, making it easy for users to understand their costs
- User-friendly interface and fast setup process, enabling quick monitoring implementation.
- Built-in support for popular frameworks and libraries.
- Their dev-to-dev approach makes support more accessible and practical for engineering teams
Cons
- Limited Language Support
- Integration of essential services is limited
- While 1 GB of log storage is free, storing more requires buying an add-on
Pricing
- Free plan
- Paid plan starts from $23 per month
Best For
Startups and small to medium teams will find this tool ideal, particularly if they want simple, predictable observability without hefty license fees. Additionally, engineering teams that prioritize developer experience will appreciate its dev-friendly support and clean UI.
Why It’s an Affordable Alternative
AppSignal charges based on requests rather than hosts like Datadog does, which can save you money if your app experiences bursty traffic or runs across many hosts. Moreover, the platform simplifies monitoring for teams of any size by offering a strong set of core features, all-inclusive plans, and straightforward pricing. Additionally, their relaxed upgrade policy makes it easy to scale as your needs grow.
9. Sentry
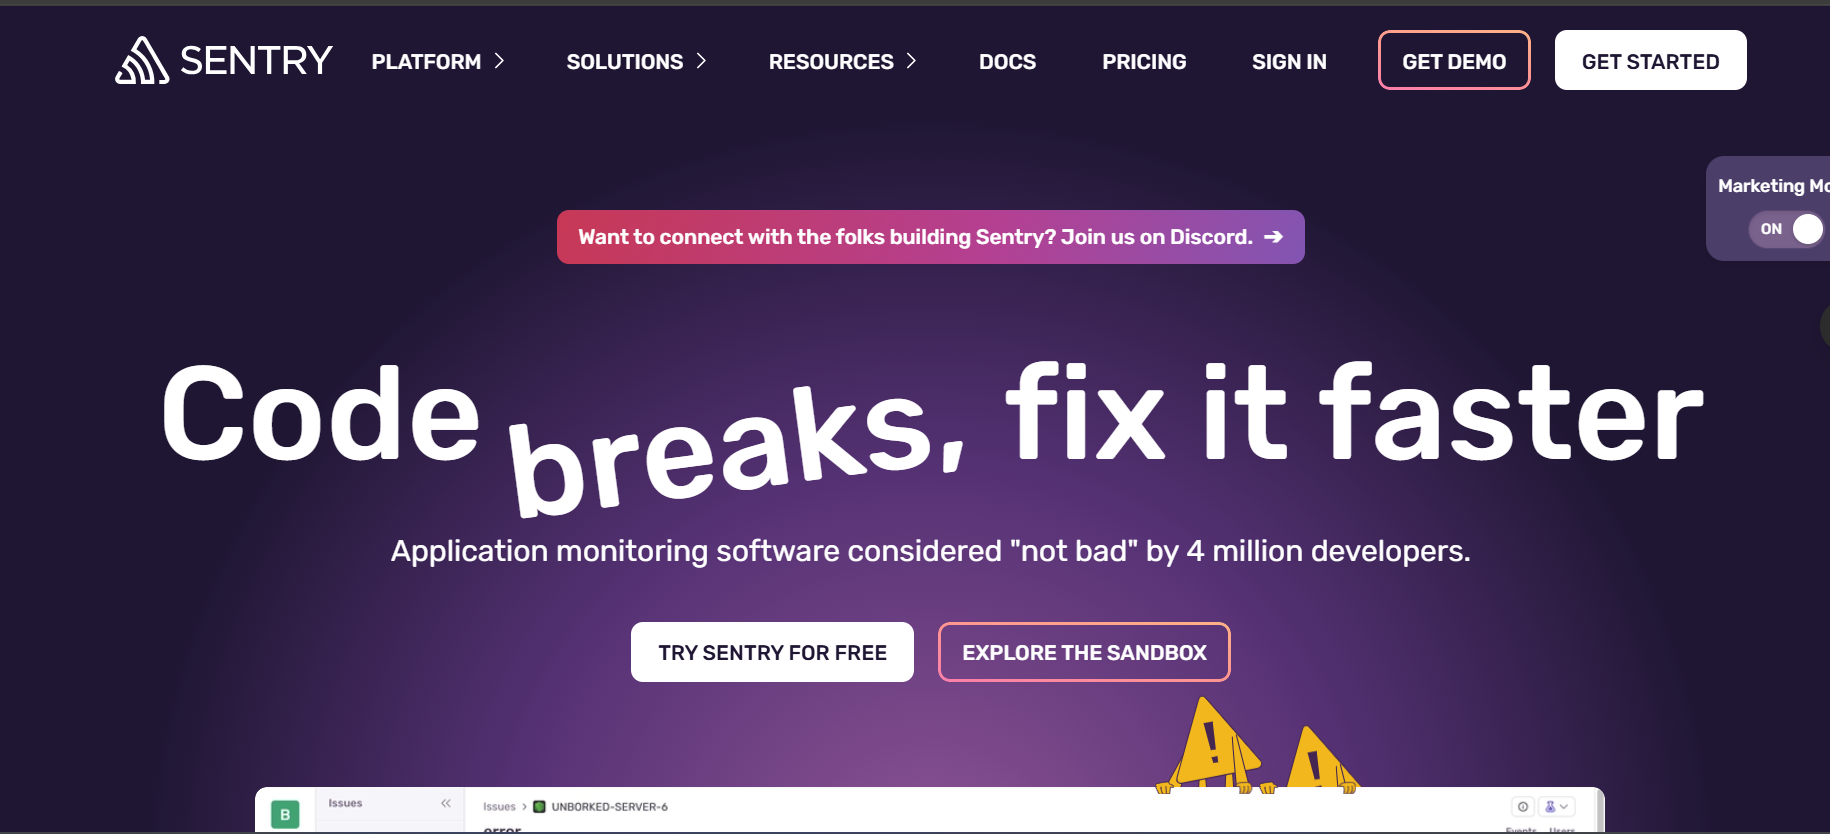
Sentry is an open-source platform for error tracking and application performance monitoring. It’s easier to install and set up than Datadog, and it detects code-level errors in real time so engineers can fix issues before users ever experience them.
Features
- Broad Software Support
- It helps developers fix application errors quickly.
- Allows you to replay user sessions (on web/mobile) to see exactly what users did before an error or issue.
- Supports distributed tracing to monitor application performance, transaction latency, and throughput
Pros
- Sentry supports a wide range of programming languages.
- Clear and detailed error reporting for effective troubleshooting.
- Detailed documentation and a big community.
- Very strong support for error tracking with detailed context (stack traces, user info), making debugging faster..
- Works with many third-party tools (e.g., GitHub, Slack, Jira) for notifications, workflows, and issue tracking.
Cons
- New users may find it challenging to fully utilize all Sentry features due to its complex UI
- Users can quickly hit error limits if a small bug occurs frequently
- Limited support for CPU, memory, and container-level monitoring.
- Less supported platforms
Pricing
Team plan starts at $26/month.
Best For
Developers & Engineering Teams and SaaS/Product Teams.
Why It’s an Affordable Alternative
Sentry charges teams based on events and trace volume. Therefore, it often costs less than Datadog for teams that focus primarily on application-level errors and performance monitoring.
10. LogicMonitor
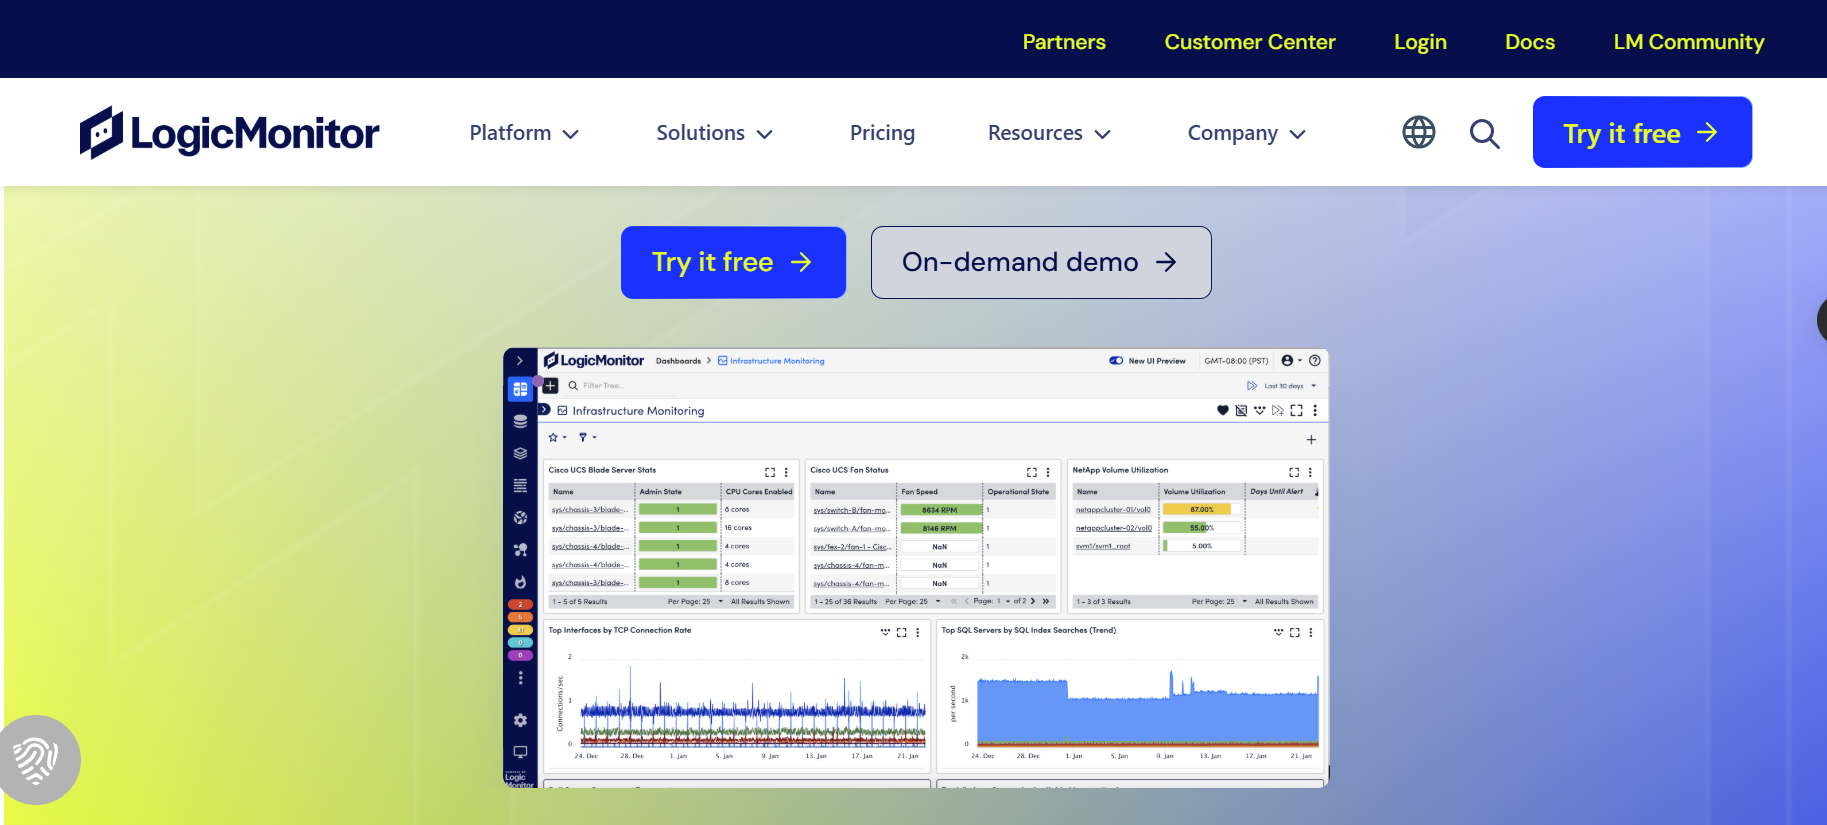
LogicMonitor is a SaaS-based hybrid observability platform that helps organisations monitor and optimise their entire IT infrastructure. The platform delivers AI-powered AIOps features like anomaly detection, root-cause analysis, and forecasting. As a result, it stands out as a strong Datadog alternative, particularly for infrastructure monitoring. The platform combines cloud, infrastructure, and application monitoring in one place and connects seamlessly with over 3,000 integrations.
Features
- Automatic Discovery & Topology Mapping
- Tracks configuration changes on devices and alerts on deviations.
- Can run diagnostic scripts automatically when alerts happen to gather critical troubleshooting data
- Provides custom dashboards, out-of-the-box reports, and forecasting visualizations
- Pricing is based on resources, with volume discounts available for large deployments
Pros
- Very broad monitoring coverage, infrastructure, network, cloud, on-prem, all in one platform
- Automatically detects new devices/services and maps their dependencies
- Since it’s SaaS, you don’t need to manage monitoring infrastructure.
- Comes with 3,000+ integrations
- LogicMonitor offers community, documentation, and training via “LM Academy”
Cons
- New users (especially junior engineers) take time to understand and optimize the platform fully
- Some analyses suggest its built-in security observability is weaker; security may have to be handled by other tools.
- Some users report friction in the sales or trial onboarding process.
Pricing
- Infrastructure Monitoring: $22 per resource/month
- Cloud IaaS Monitoring: $22 per resource/month
- Wireless Access Points: $4 per unit/month
- Cloud PaaS & Container Monitoring: $3 per resource/month
- Log Intelligence: Starting at $2.50 per GB/month
Best For
Medium to large enterprises with hybrid IT environments, on-prem servers + cloud + network gear.
Why It’s an Affordable Alternative
Conclusion
Switching from Datadog doesn’t mean losing quality or essential features. Instead, it opens the door to tools that fit your budget and your team’s workflow more effectively. In fact, these ten Datadog alternatives show that you can still access reliable, full-stack monitoring without overspending.
Each platform on this list delivers strong monitoring capabilities, smarter automation, and better cost control without compromising performance or visibility. Moreover, whether you need full-stack observability, lightweight open-source flexibility, or enterprise-level automation, you can find a solution that actively provides the insights your team relies on.
Additionally, when you evaluate factors such as pricing, integrations, deployment speed, and root-cause analysis, you can confidently choose a tool that helps your team move faster and troubleshoot more efficiently. More importantly, the best alternative isn’t just the cheaper option; it’s the one that empowers your engineers to stay proactive, resilient, and prepared for growth.