

Choosing flowchart software can be difficult when so many tools offer different features. A product manager mapping a signup process may need different features from an analyst documenting an approval process or a developer planning a system. Some tools support swimlanes, data linking, and detailed diagrams. Others focus on whiteboarding, simple charts, or technical diagrams.
We compared 20 flowchart software to consider in 2026. It covers popular options like Lucidchart and SmartDraw, along with free and open-source tools like diagrams.net and Mermaid. For each tool, you’ll find its main features, what it does well, its drawbacks, and who should use it. Use the comparison table to narrow down your options. Then read the full reviews to find a tool that suits your work and budget.
20 Best Flowchart Software in 2026
1. Lucidchart

Lucidchart is a browser-based diagramming application built around drag-and-drop shape libraries, connectors, and templates. Users build flowcharts, swimlane process maps, org charts, and technical diagrams on one canvas, with AI-assisted generation available in recent versions. Its distinguishing angle is structure: shapes can be linked to data, diagrams can be imported from and exported to Visio files, and documents tie into Google Workspace, Microsoft 365, and Atlassian tools. That makes it a more rigid, documentation-oriented choice than a free-form whiteboard such as Miro.
Key Features
- Data linking: Connects shapes to spreadsheet or database fields, useful for process diagrams that should reflect current figures.
- Visio import and export: Eases migration for teams moving away from Visio files.
- Templates and shape libraries: Speeds up BPMN, swimlane, and UML work.
- Commenting and real-time editing: Supports review cycles on shared diagrams.
Pros
- Strong fit for documented, repeatable process maps.
- Wide integration coverage across common workplace suites.
- Good for teams that must exchange files with Visio users.
Cons
- Free tiers have been reported to limit documents and objects; confirm current limits.
- Advanced security and admin controls typically sit on higher tiers.
- Per-seat pricing can add up for large teams.
Pricing
- Free: $0
- Individual: $9/month
- Team: $10/user/month
- Enterprise: Contact sales
Best For
Business analysts and operations teams documenting approval workflows who need shared, structured diagrams.
When to Consider an Alternative
Choose Miro for brainstorming-heavy sessions, or diagrams.net if budget is the main constraint.
2. Microsoft Visio

Visio is Microsoft’s diagramming product, available as a web app and a Windows desktop application. Flowcharts are built from stencils and templates, including cross-functional (swimlane) flowcharts, BPMN, and network or floor-plan diagrams. Its Data Visualizer feature turns structured data, such as an Excel table, into a diagram. The tie to Microsoft 365, Teams, and SharePoint is the main reason organizations standardize on it, and the desktop version has historically been Windows-only.
Key Features
- Cross-functional flowchart templates: Lay out responsibilities by role or department.
- Data Visualizer: Generates process diagrams from Excel data.
- Microsoft 365 integration: Embed diagrams in Teams and SharePoint.
- Large shape and stencil library: Covers engineering, IT, and process notations.
Pros
- Deep fit with Microsoft environments.
- Rich notation support for formal process modeling.
- Familiar format that many enterprises already store.
Cons
- Desktop application has been Windows-focused; web version is lighter.
- Licensing varies by plan and edition, which can confuse buyers.
- Less suited to informal brainstorming.
Pricing
- Visio in Microsoft 365: Included in Microsoft 365 commercial plans
- Visio Plan 1: $5/user/month
- Visio Plan 2: $15/user/month
Billed annually.
Best For
Enterprise teams maintaining controlled process documentation inside Microsoft 365.
When to Consider an Alternative
Lucidchart or Creately may suit mixed-platform, browser-first teams better.
3. Miro

Miro is an infinite-canvas whiteboard where flowcharts are one of many board objects. Users drag shapes and connectors onto a board next to sticky notes, templates, and workshop frameworks, which suits sessions where a process is discovered rather than documented. Recent versions add AI features for generating diagrams. Compared with a dedicated diagramming tool, Miro offers less rigid structure but far more freedom for live, multi-person work.
Key Features
- Infinite canvas: Room for large, evolving process maps.
- Diagramming shapes and smart connectors: Build flowcharts directly on the board.
- Template library: Starts workshops and mapping sessions quickly.
- Real-time collaboration: Multiple participants edit and comment together.
Pros
- Excellent for workshops and cross-team mapping.
- Combines flowcharts with notes, voting, and planning.
- Broad integration ecosystem.
Cons
- Less precise for strict technical or notation-heavy diagrams.
- Large boards can become cluttered.
- Free-plan board limits have been reported; confirm.
Pricing
- Free: $0
- Starter: $8/member/month
- Business: $20/member/month
- Enterprise: Custom pricing (from 30 members)
Starter and Business are billed annually.
Best For
Product managers mapping user journeys with stakeholders in a live session.
When to Consider an Alternative
Use Lucidchart or Visio for polished, controlled process documentation.
4. Creately

Creately is a visual collaboration workspace combining diagramming, whiteboarding, and project-style views. Its flowchart workflow centers on smart shapes and quick-add controls that create connected shapes with a click, followed by templates and formatting tools. It supports many diagram types beyond flowcharts, including UML, org charts, and wireframes. Compared with Lucidchart, it leans toward speed and breadth over enterprise governance.
Key Features
- Quick-add shape creation: Builds connected flowchart steps with fewer drags.
- Template library: Covers process, UML, and planning diagrams.
- Real-time collaboration: Shared editing and comments.
- Data and notes on shapes: Attach context to steps.
Pros
- Speeds up building simple to mid-size flowcharts.
- Covers many diagram types in one workspace.
- Approachable for non-specialists.
Cons
- Smaller integration ecosystem than the largest players (verify).
- Advanced features may sit on paid tiers.
- Less brand recognition for enterprise procurement.
Pricing
- Free: $0
- Pro: $8/editor/month
- Business: $149/organization/month
- Enterprise: Custom pricing
All plans are billed monthly except Enterprise, which requires an annual agreement.
Best For
Small teams that want one tool for flowcharts, UML, and planning boards.
When to Consider an Alternative
Visio suits strict enterprise standardization; Miro suits workshop-first teams.
5. SmartDraw

SmartDraw emphasizes automation. Users pick a template or start with a symbol, and the software automatically aligns, spaces, and connects shapes as they are added, reducing manual layout work. It covers flowcharts, org charts, floor plans, and IT diagrams, and has offered Visio file import. Its approach differs from whiteboard tools: the goal is clean, consistent output with minimal formatting effort.
Key Features
- Automatic formatting: Keeps spacing and alignment tidy as you edit.
- Large template library: Starts common business diagrams quickly.
- Visio import: Helps with legacy file migration.
- App integrations: Connects with common office and Atlassian tools (verify current list).
Pros
- Produces consistent-looking diagrams with little effort.
- Suitable for non-designers.
- Wide range of business diagram types.
Cons
- Less free-form than whiteboard tools.
- Collaboration depth should be confirmed against current plans.
- Pricing model has varied historically; confirm.
Pricing
- Individual: $5.75/month (was $10.95)
- Team: $4.95/user/month (was $10.95), 3-user minimum
Introductory prices for new customers only. Billed annually.
Best For
Operations teams creating standard operating procedure diagrams.
When to Consider an Alternative
Choose Miro for collaborative ideation or diagrams.net for a no-cost option.
6. diagrams.net (draw.io)

diagrams.net, formerly draw.io, is an open-source diagramming editor that runs in the browser or as a desktop app. Users drag shapes from libraries, connect them, and save to a chosen location, including a local device, Google Drive, OneDrive, or GitHub. It needs no account for basic use and supports flowcharts, UML, network diagrams, and more. Its trade-off is a plainer interface and fewer built-in AI and automation features than commercial platforms.
Key Features
- Flexible storage: Choose where files live, which helps with data control.
- Large shape libraries: Cover flowcharts, UML, AWS and other architectures.
- Desktop and web versions: Work offline or in the browser.
- Export options: PNG, SVG, PDF, and editable formats.
Pros
- Free and open source.
- Strong portability and storage control.
- Handles technical diagrams alongside flowcharts.
Cons
- Interface can feel dated to some users.
- Real-time collaboration depends on the storage integration used.
- Fewer guided templates and AI features than commercial tools.
Pricing
Diagrams.net (draw.io) is completely free for its web and desktop applications, with no account requirements, file limits, or subscription paywalls
Best For
Small businesses and individuals needing capable flowcharts without a subscription.
When to Consider an Alternative
Lucidchart or Creately offer smoother collaboration and managed support.
7. EdrawMax
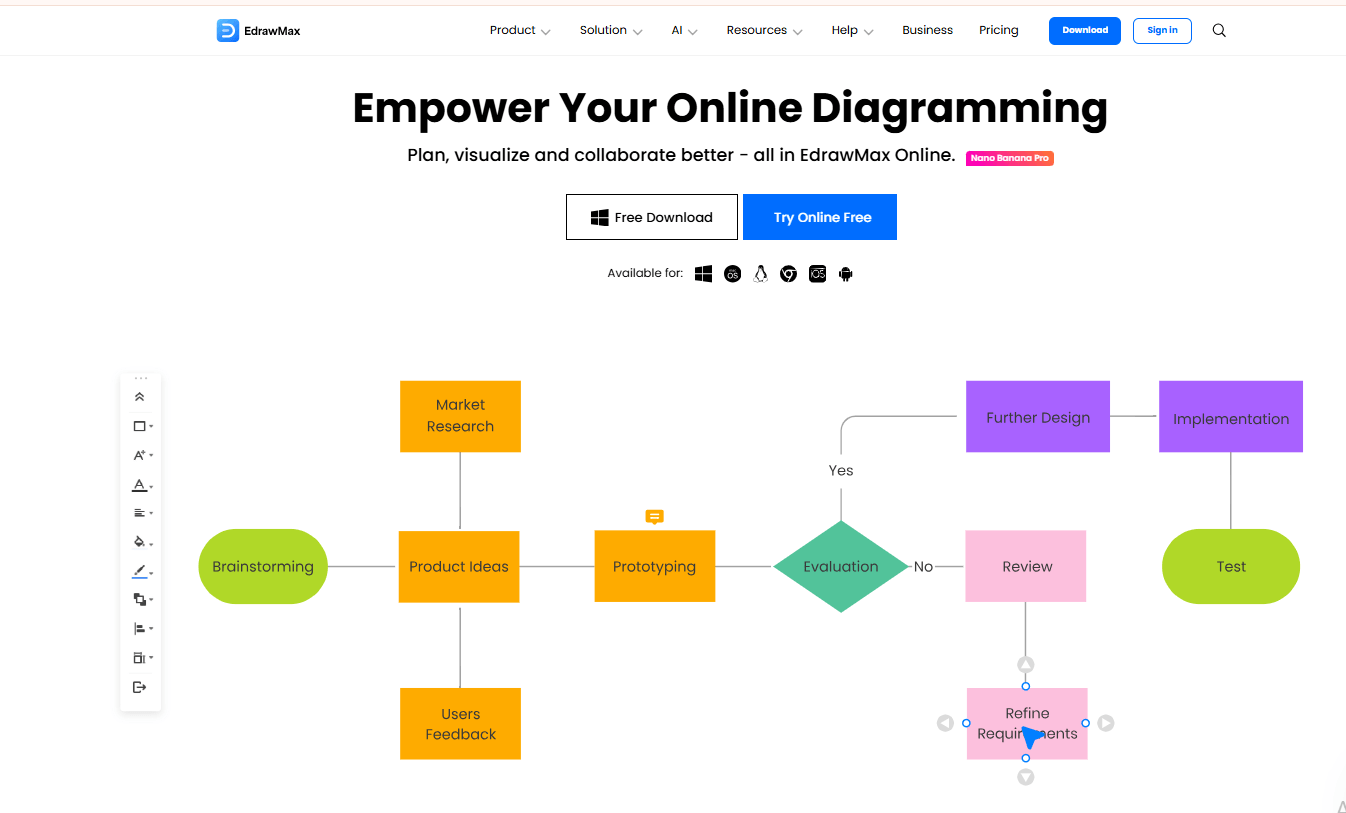
EdrawMax, from EdrawSoft (Wondershare), is a diagramming suite available on desktop and the web. It pairs flowchart tools with a very large catalog of templates and symbols, covering process maps, floor plans, engineering diagrams, and infographics. Users build flowcharts with drag-and-drop shapes, and export to formats such as Word, PowerPoint, PDF, and Visio. Historically it has offered perpetual-license options alongside subscriptions, which sets it apart from subscription-only rivals.
Key Features
- Template and symbol libraries: Large catalog across many industries.
- Office-format exports: Move diagrams into Word, PowerPoint, and PDF.
- Visio import and export: Eases file exchange.
- AI-assisted creation: Available in recent versions (verify).
Pros
- Broad coverage of diagram categories.
- Possible perpetual licensing (confirm).
- Strong export formats.
Cons
- Breadth can overwhelm new users.
- Team collaboration depth should be confirmed.
- Licensing options vary and need checking.
Pricing
- Free: $0
- Basic: $5.90/month
- Unlimited: $8.25/month
Best For
Teachers and small businesses needing a single app for many diagram types.
When to Consider an Alternative
Use Lucidchart for team-based work with heavy integrations.
8. Gliffy

Gliffy is a diagramming tool developed by Perforce, best known for its Confluence and Jira apps, which let teams create and edit diagrams directly inside Atlassian pages and issues. Users build flowcharts from a shape palette with a straightforward drag-and-drop editor. Its value is workflow proximity: diagrams stay next to the documentation that references them, rather than in a separate app.
Key Features
- Confluence and Jira apps: Edit diagrams where documentation lives.
- Drag-and-drop editor: Simple flowchart building.
- Templates: Starting points for common diagrams.
- Sharing and embedding: Distribute diagrams in team spaces.
Pros
- Natural fit for Atlassian users.
- Easy to learn.
- Keeps diagrams with related documents.
Cons
- Less advanced than full diagramming suites.
- Value drops outside the Atlassian ecosystem.
- Product positioning and plans should be confirmed.
Pricing
- Free: $0 (up to 10 users)
- Paid: $3.80/user/month (11–100 users)
- Gliffy Zero Egress: From $2.80/month
Best For
Software and IT teams documenting processes in Confluence.
When to Consider an Alternative
Lucidchart or draw.io may offer more flexibility outside Atlassian.
9. FigJam

FigJam is Figma’s collaborative whiteboard. Flowcharts are built with connectors and shapes alongside sticky notes, stamps, and widgets, and the tool shares an account and file structure with Figma design files. AI features can generate diagrams from prompts in recent releases. It suits user-journey and flow discussions among designers and product managers, though it is not a notation-heavy process modeling tool.
Key Features
- Connectors and flowchart shapes: Quick flow sketches.
- Figma ecosystem link: Move between design files and boards.
- Stickies, voting, and templates: Support workshop activities.
- AI diagram generation: Verify availability by plan.
Pros
- Natural for teams already in Figma.
- Fast for informal flows and journeys.
- Approachable for non-technical collaborators.
Cons
- Not built for BPMN or formal modeling.
- Large, structured diagrams can be harder to maintain.
- Seat-based pricing tied to Figma plans (verify).
Pricing
- Starter: Free
- Professional: $16/month (Full seat), $12/month (Dev seat), $3/month (Collab seat)
- Organization: $55/month (Full seat), $25/month (Dev seat), $5/month (Collab seat)
- Enterprise: $90/month (Full seat), $35/month (Dev seat), $5/month (Collab seat)
Best For
Product designers mapping user flows with teammates.
When to Consider an Alternative
Use Lucidchart or Visio for controlled process documentation.
10. Whimsical
Whimsical combines flowcharts, wireframes, mind maps, and documents in one workspace, with an editor designed for speed. Users create flowchart steps with keyboard shortcuts and automatic connectors, producing clean, consistent diagrams. AI generation of flowcharts is available in recent versions (verify). It trades notation depth for simplicity, which makes it appealing to product and startup teams.
Key Features
- Keyboard-driven flowchart creation: Build diagrams quickly.
- Flowcharts plus docs and wireframes: Combine planning artifacts.
- Sharing and commenting: Collaborate on boards.
- AI flowchart generation: Confirm plan availability.
Pros
- Fast and easy to learn.
- Clean default styling.
- Good for lightweight planning.
Cons
- Limited formal notation support.
- Free-plan board limits have been reported (confirm).
- Less suited to large technical diagrams.
Pricing
- Free: $0/editor/month
- Pro: $10/editor/month
- Business: $20/editor/month
Best For
Startups and product managers who need quick, readable flowcharts.
When to Consider an Alternative
Choose Lucidchart or Visio for complex process notation.
11. Canva

Canva is a general design platform with flowchart templates and drag-and-drop editing. Users start from a template, swap in text and shapes, and style the result with Canva’s fonts, colors, and brand kit features. The output suits slides, reports, and social or internal communications. It is a design tool first, so it lacks data linking, formal notations, and the automatic connector behavior of dedicated diagramming apps.
Key Features
- Flowchart templates: Start from a styled layout and edit.
- Brand styling tools: Keep diagrams consistent with company visuals.
- Presentation and document export: Use flowcharts directly in slides and PDFs.
- Shared editing and comments: Review designs with teammates.
Pros
- Very low learning curve.
- Attractive output for non-technical audiences.
- One tool for flowcharts and other marketing or training visuals.
Cons
- Not built for complex or notation-based diagrams.
- Editing connectors can be less precise than in dedicated tools.
- Some design assets and features sit behind paid plans (verify).
Pricing
- Free: $0
- Pro: $18/month or $180/year
- Business: $25/person/month or $250/person/year
- Enterprise: Contact sales
- Education: Free (eligible users)
- Nonprofits: Free (up to 50 verified users)
Plans covering flowchart creation: Free, Pro, Business, Enterprise, Education and Nonprofits. All plans provide access to Canva’s design tools, but advanced team, brand management and collaboration features vary by plan.
Best For
Marketing and training teams who need polished flowcharts for presentations.
When to Consider an Alternative
Use Lucidchart, Visio, or diagrams.net when diagrams must be maintained as working documentation.
12. Cacoo

Cacoo, from Nulab, is a browser-based diagramming app focused on real-time team editing. Users assemble flowcharts, wireframes, and network diagrams from templates and shape libraries, while others edit the same canvas and leave comments. Its distinct angle is the Nulab ecosystem, including project management (Backlog) and chat tools, which makes diagrams easy to share with teams already in those products.
Key Features
- Real-time collaborative editing: Several people work on one diagram.
- Templates and shape libraries: Quick starts for common diagrams.
- Nulab tool integration: Link diagrams to Backlog work.
- Sharing and comment threads: Gather feedback in context.
Pros
- Simple, approachable editor.
- Collaboration is central to the design.
- Convenient for existing Nulab users.
Cons
- Smaller ecosystem than larger competitors.
- Fewer advanced modeling features.
- Current plan structure should be confirmed.
Pricing
- Free: $0
- Pro: $6/user/month
- Team: $6/user/month
- Enterprise: Custom pricing
Best For
Small project teams that share diagrams during sprint and planning work.
When to Consider an Alternative
Choose Lucidchart or Miro for broader integrations and larger user communities.
13. MindManager
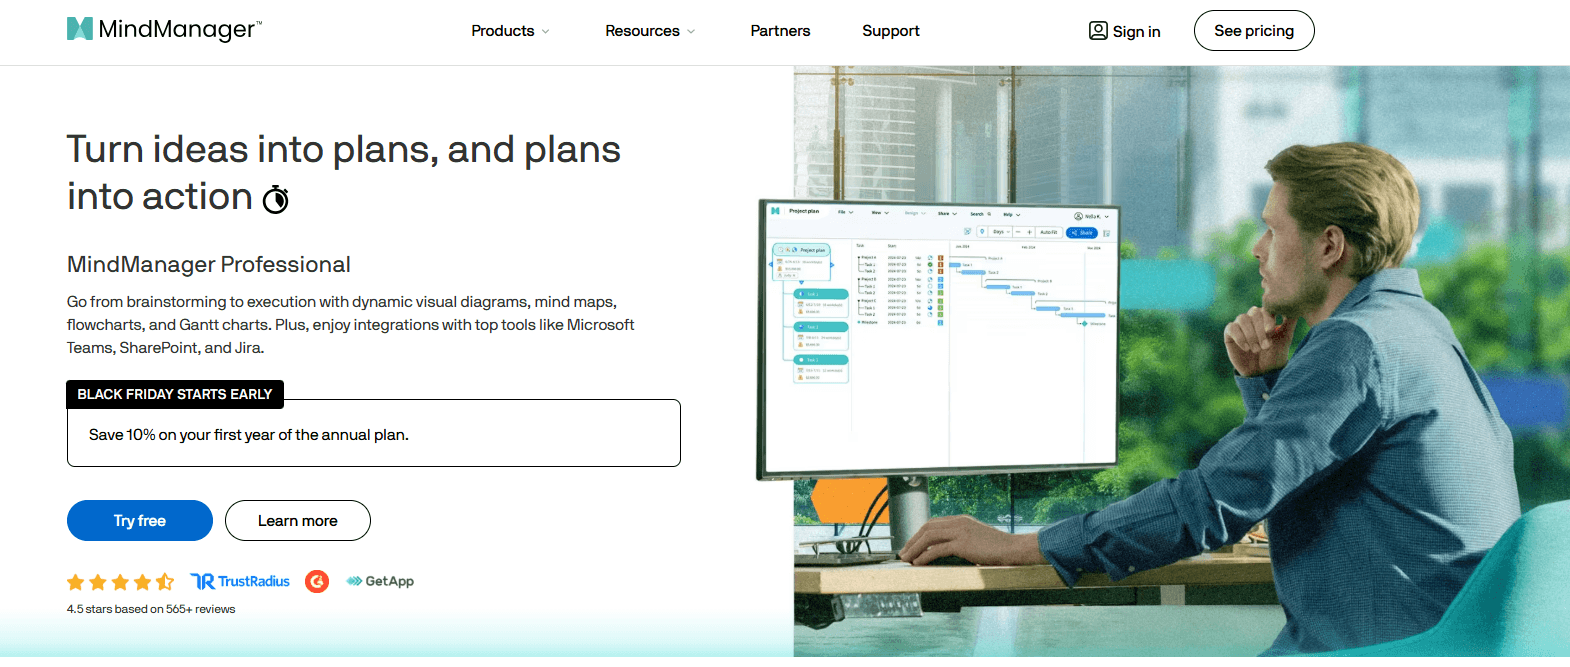
MindManager, from Mindjet, began as a mind-mapping tool and now includes flowchart and process-map elements. Users start with a central topic, branch out ideas, and can then convert thinking into structured maps or process diagrams. It integrates with Microsoft Office, so maps can feed into documents and presentations. Its approach differs from a canvas-first diagramming app: the mind-map structure comes first, and flowcharting is one of several outputs.
Key Features
- Mind map to process view: Turn brainstormed topics into structured outlines or flows.
- Flowchart and process map elements: Document steps and decisions.
- Microsoft Office integration: Export and embed maps in Word and PowerPoint.
- Desktop and collaborative options: Confirm current platform coverage.
Pros
- Ideal when planning and documentation overlap.
- Familiar to knowledge workers who use mind maps.
- Good Office tie-ins.
Cons
- Flowchart depth is narrower than dedicated tools.
- Pricing and licensing need confirmation.
- Less suitable for technical diagrams.
Pricing
- Essentials: $89/year
- Professional: $159/year
- Enterprise: Special pricing available
Best For
Project managers who plan work in mind maps and then formalize the process.
When to Consider an Alternative
SmartDraw or Lucidchart suit teams that primarily need polished flowcharts.
14. ConceptDraw DIAGRAM
ConceptDraw DIAGRAM is a desktop diagramming application for Windows and Mac from CS Odessa. Users pick from solution libraries, which are add-on collections of templates and stencils for flowcharts, business process diagrams, and other categories, then draw with standard shape and connector tools. It has traditionally been sold with perpetual licensing options and sits within a wider ConceptDraw Office suite that includes mind mapping and project tools.
Key Features
- Solution libraries: Add templates and stencils by diagram category.
- Windows and Mac desktop apps: Work offline.
- Office suite integration: Pair with mind map and project modules.
- Export formats: Common image, PDF, and Visio formats (verify).
Pros
- Works offline with local files.
- Licensing may suit teams avoiding subscriptions (confirm).
- Covers many diagram categories.
Cons
- Not browser-native; weaker for real-time collaboration.
- Interface feels more traditional.
- Add-on libraries can complicate purchase decisions.
Pricing
- ConceptDraw OFFICE 11: $299
- ConceptDraw DIAGRAM 18: $199
- ConceptDraw PROJECT 15: $299
- ConceptDraw MINDMAP 16: $199
- ConceptDraw MINDMAP 16 + PROJECT 15: $3
Best For
Individual professionals or consultants who prefer installed software.
When to Consider an Alternative
Choose Lucidchart or Creately for cloud-based team editing.
15. Visual Paradigm

Visual Paradigm is a modeling suite for UML, BPMN, ArchiMate, and related notations, offered as desktop software and an online edition. Flowcharts are one part of a larger modeling toolkit: users can create process diagrams with BPMN semantics, link models across a project, and generate documentation. It is better suited to analysts who must follow modeling standards than to people who need a quick sketch.
Key Features
- BPMN and UML modeling: Follow formal standards with notation validation.
- Cross-model linking: Trace relationships across diagrams.
- Documentation generation: Produce reports from models.
- Desktop and online editions: Confirm feature differences.
Pros
- Strong standards-based modeling.
- Useful for enterprise architecture and software design.
- Possible free community edition (verify scope).
Cons
- Steeper learning curve than general flowchart apps.
- Overbuilt for simple diagrams.
- Edition and license structure can be complex.
Pricing
- Enterprise: $1,999
- Professional: $799
- Standard: $349
- Modeler: $99
Best For
Business analysts and software architects modeling with BPMN, UML, or ArchiMate.
When to Consider an Alternative
Use Lucidchart, draw.io, or Whimsical for quick, less formal flowcharts.
16. yEd Graph Editor
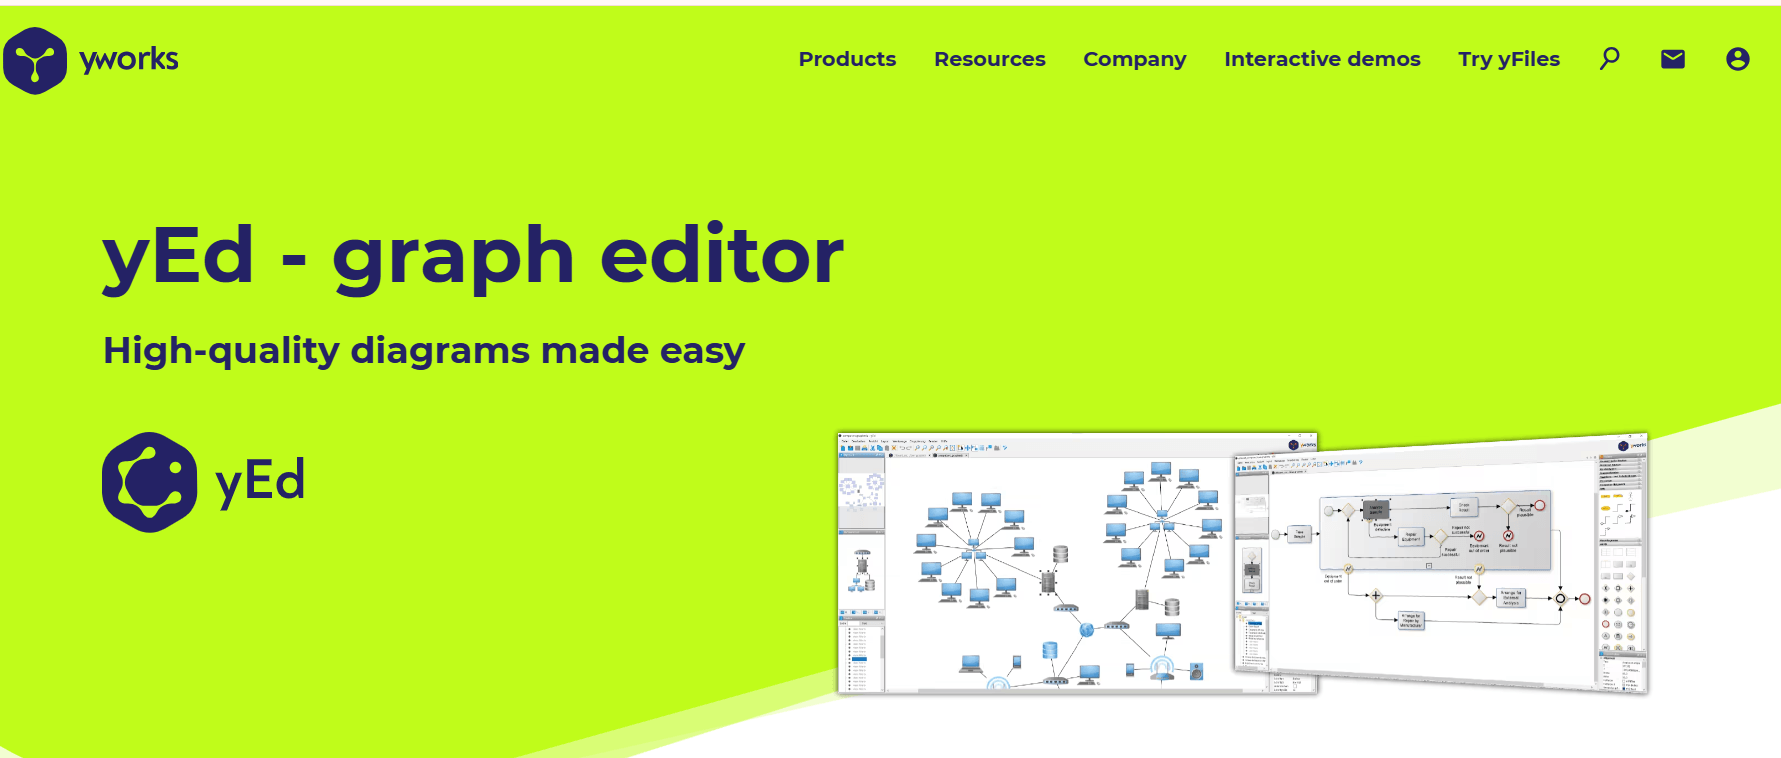
yEd is a free desktop diagram editor from yWorks. Its signature capability is automatic layout: users can import data, such as Excel or XML, or draw a diagram manually, and then apply algorithms such as hierarchical, organic, or circular layouts to arrange the nodes. That makes it useful for large, interconnected flowcharts and network-style diagrams that would take hours to position by hand. It has no real-time collaboration and a utilitarian interface.
Key Features
- Automatic layout algorithms: Arrange large diagrams in seconds.
- Data import: Build diagrams from spreadsheets or structured files.
- Flowchart and network shape sets: Cover process and technical diagrams.
- Cross-platform desktop app: Runs on Windows, macOS, and Linux.
Pros
- Free to use
- Handles large graphs better than many drawing tools.
- Good for analysis of connected data.
Cons
- No built-in cloud collaboration.
- Interface and styling options feel dated.
- Less suited to polished presentation visuals.
Pricing
- Price: $0 (Free for end-users)
Best For
Analysts and engineers visualizing large process or dependency graphs.
When to Consider an Alternative
Use diagrams.net or Lucidchart for presentation-ready, collaborative diagrams.
17. Mermaid

Mermaid is an open-source, JavaScript-based tool that renders diagrams from text. A short Markdown-inspired syntax, such as a graph direction followed by node and arrow definitions, produces flowcharts, sequence diagrams, and others. Many platforms render Mermaid natively, including GitHub, GitLab, and several note and wiki tools, so diagrams can live in repositories and version history. It has no drag-and-drop canvas; control comes from writing text. A separate commercial offering, Mermaid Chart, adds a hosted editor.
Key Features
- Text-based syntax: Create and edit flowcharts through code.
- Markdown rendering support: Embed diagrams in documentation.
- Live editor: Preview diagrams in the browser.
- Multiple diagram types: Flowcharts, sequence, state, and more.
Pros
- Diagrams are diff-able and version-controlled.
- Free open-source core .
- Fits documentation workflows.
Cons
- Learning syntax is required.
- Limited manual layout control.
- Harder for non-technical collaborators.
Pricing
- Basic: Free
- Plus: $10/user/month
- Premium: $20/user/month
- Enterprise: Custom pricing
Best For
Developers documenting systems in READMEs, wikis, and pull requests.
When to Consider an Alternative
Choose diagrams.net or Lucidchart when non-developers must edit diagrams visually.
18. Excalidraw
Excalidraw is an open-source virtual whiteboard that renders shapes in a hand-drawn style. Users draw boxes, arrows, and text on a canvas and can start immediately in the browser, sharing a link for live collaboration. The sketch look suits early design discussions, where a deliberately rough flowchart signals that it is a draft. It lacks formal flowchart libraries, data linking, and automatic layout, and a paid tier, Excalidraw+, adds workspace features.
Key Features
- Hand-drawn rendering: Keeps diagrams informal and quick.
- Link-based collaboration: Share a session instantly.
- Libraries and export: Reuse shapes and export images.
- Open-source code: Allows self-hosting or embedding.
Pros
- Immediate to start, with minimal interface.
- Good for early architecture and design sketches.
- Open-source flexibility.
Cons
- Not suited to formal process documentation.
- Limited structure for large diagrams.
- Advanced workspace features may require a paid plan.
Pricing
- Free: $0
- Plus: $6/user/month
Best For
Engineers and designers sketching ideas in meetings.
When to Consider an Alternative
Use diagrams.net, Whimsical, or Lucidchart for polished flowcharts.
19. ProcessOn
ProcessOn is an online diagramming platform that supports flowcharts, mind maps, UML, and org charts, and it offers a community template gallery that users can copy and adapt. It originated in China, and an international edition exists. Because pricing and plan structure may differ by region and currency, readers should check the English site carefully. Product depth and English-language documentation should be confirmed before choosing it for team use.
Key Features
- Online flowchart editor: Browser-based drawing with shape libraries.
- Community templates: Start from shared examples.
- Mind maps and UML: Additional diagram types in one account.
- Sharing and collaboration: Confirm current capabilities.
Pros
- Broad diagram support.
- Template gallery accelerates start-up.
- Reported free tier
Cons
- English documentation and support depth should be confirmed.
- Pricing may be listed in another currency; do not assume USD.
- Fewer Western-ecosystem integrations
Pricing
- Free: $0
- Monthly: $12/month
- Yearly: $60/year
- Lifetime: $129 (one-time payment)
Best For
Individual users and small teams who want a web-based editor with a large template gallery.
When to Consider an Alternative
Choose Lucidchart, Creately, or diagrams.net for broader English-language support and ecosystem coverage.
20. PlantUML
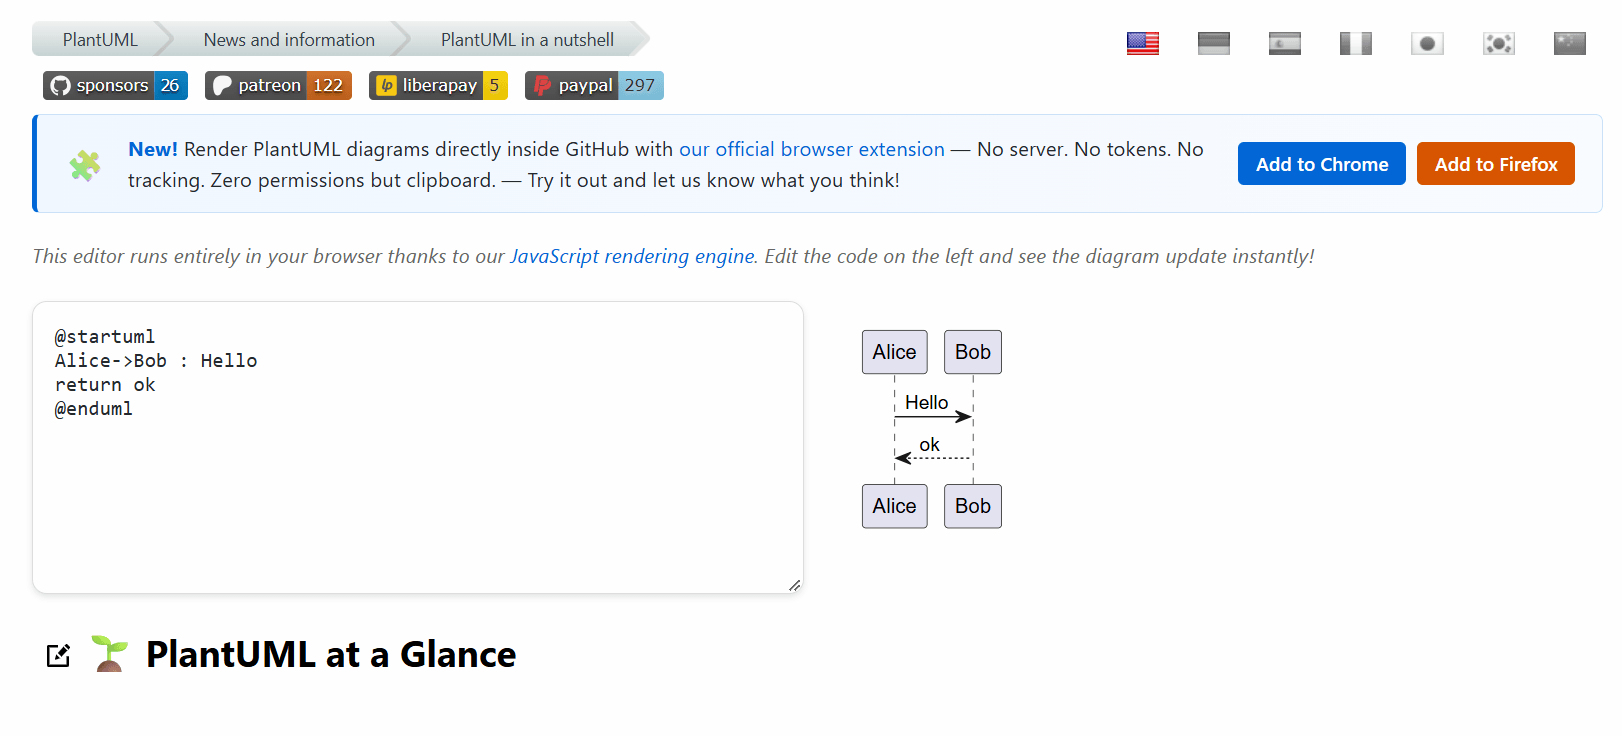
PlantUML is an open-source tool that generates diagrams from a plain-text description. For flowcharts, its activity diagram syntax expresses steps, decisions, loops, and parallel flows in readable code. It supports many UML diagram types, and plugins connect it to IDEs, wikis, and documentation systems. Some rendering relies on Java and Graphviz, so setup is more involved than a browser editor. Compared with Mermaid, it is more established in UML-heavy workflows but typically less natively rendered by popular Markdown platforms.
Key Features
- Activity diagram syntax: Express process logic as text.
- Many UML diagram types: Sequence, class, state, and more.
- IDE and wiki plugins: Integrate with developer tools.
- Server and local rendering options: Choose how diagrams are generated.
Pros
- Version-control friendly.
- Mature ecosystem for UML work.
- Open source.
Cons
- Syntax and setup have a learning curve.
- Default styling looks plainer than modern design tools.
- Limited visual editing.
Pricing
- Core / Open-Source: $0 (Free forever)
- Professional Edition: Custom pricing (request a quote)
Best For
Software teams documenting behavior and architecture alongside code.
When to Consider an Alternative
Choose Mermaid for wider native rendering, or a visual editor such as diagrams.net for non-developers.
How to Choose the Right Flowchart Software
1. Intended use
Simple flowcharts need a fast editor such as Whimsical or Canva. Business process mapping benefits from swimlanes and notation support, as in Visio, Lucidchart, or Visual Paradigm. Technical architecture favors diagrams.net, Mermaid, or PlantUML. Collaborative planning favors Miro or FigJam.
2. Ease of use
Drag-and-drop editors are the easiest starting point. Text-based tools such as Mermaid and PlantUML reward developers who want diagrams in version control, but they exclude collaborators who do not code. Modeling suites offer depth with a steeper learning curve.
3. Collaboration
Real-time editing matters when several people build one diagram. Comments, permissions, and version history matter when diagrams become controlled documentation. Confirm which of these sit on paid plans.
4. Integrations
Match the tool to where your documentation already lives: Microsoft 365 for Visio, Confluence and Jira for Gliffy, Figma for FigJam, or GitHub for Mermaid.
5. Pricing
Compare free plans on their limits (documents, shapes, boards, users), not just their existence. Note whether paid pricing is per user, per workspace, or a perpetual license, and whether the quoted rate assumes annual billing. Enterprise tiers often require a quote. Verify all of this on the vendor’s official pricing page.
6. Export and portability
Check for editable exports, Visio compatibility, SVG and PDF output, and whether you can keep files if you cancel. Open formats and local storage, as in diagrams.net, reduce lock-in.
7. Security and administration
Larger organizations should check single sign-on, access controls, data location, and audit options, which many vendors reserve for enterprise tiers.
Frequently Asked Questions
What is the best flowchart software in 2026?
It depends on the job. Lucidchart and Visio are strong candidates for structured business process work, Miro for workshops, diagrams.net for a free option, and Mermaid for developers. Confirm current features and pricing before deciding.
What is the best free flowchart software?
diagrams.net is widely reported to be free and open source, and yEd, Mermaid, and PlantUML are also reported as free or open source. Several commercial tools offer limited free plans; check each one’s limits.
Which flowchart maker is easiest to use?
Whimsical and Canva are generally considered approachable for quick flowcharts, and Creately’s quick-add shape controls also lower the barrier. Ease of use is subjective, so try the free plan or trial first.
Can I create professional flowcharts online for free?
Often, yes. Browser-based tools such as diagrams.net and Excalidraw can produce usable flowcharts without a subscription, and several commercial products have free tiers with caps on documents, shapes, or boards.
What is the difference between flowchart software and diagramming software?
Flowchart software focuses on process steps and decisions. Diagramming software is a broader category that also covers network, architecture, UML, and org charts. Most products in this article do both.
Which flowchart software is best for business process mapping?
Visio, Lucidchart, and Visual Paradigm are the best-aligned options in this list because of their swimlane, BPMN, and process-modeling support. Choose among them by ecosystem and notation needs.
What features should I look for when choosing flowchart software?
Prioritize diagram types and templates, collaboration controls, integrations with your existing tools, export formats, pricing structure, and administrative features if you are buying for an organization.
Conclusion
No single product is the best flowchart software in 2026 for every reader. Start with the diagram you need to produce: a documented business process, a technical architecture, a user journey, or a quick sketch. Then weigh collaboration needs, technical comfort, budget, and integrations. Analysts in Microsoft-heavy organizations will likely begin with Visio or Lucidchart. Workshop-driven teams will gravitate to Miro or FigJam. Developers will prefer Mermaid or PlantUML. Budget-conscious users should test diagrams.net first. Before purchasing, verify current plan limits and pricing on each vendor’s official site, and run a small real project in your top two choices.