Organizations are constantly collecting data and acting quickly on this data is important. Traditional BI software often demands technical expertise to analyze data. Generating reports can be time consuming especially when the team requires the reports quickly. The switch from traditional BI to self service business intelligence software is important because it allows nontechnical users without a background in BI or related functions such as data mining, statistical analysis and data science access and explore data sets.
Self-service business intelligence software gives end users the tools and software they need to analyze large amounts of business data and build dashboards on their own. Let’s be honest, data isn’t easy or even exciting for everyone. But with self-service BI, anyone in your organization can create custom dashboards without depending on IT professionals or dedicated data analysts. This wider access to data empowers employees across every level of an organization to contribute directly to shaping business strategies.
Data inconsistencies and inaccuracies drive faulty decisions, and without deliberate oversight, teams cannot verify whether they analyze data correctly. This is why we created a list of top 10 self service business intelligence software to guide decision making,
Top 10 Best Self Service Business Intelligence Software
1. Ajelix BI
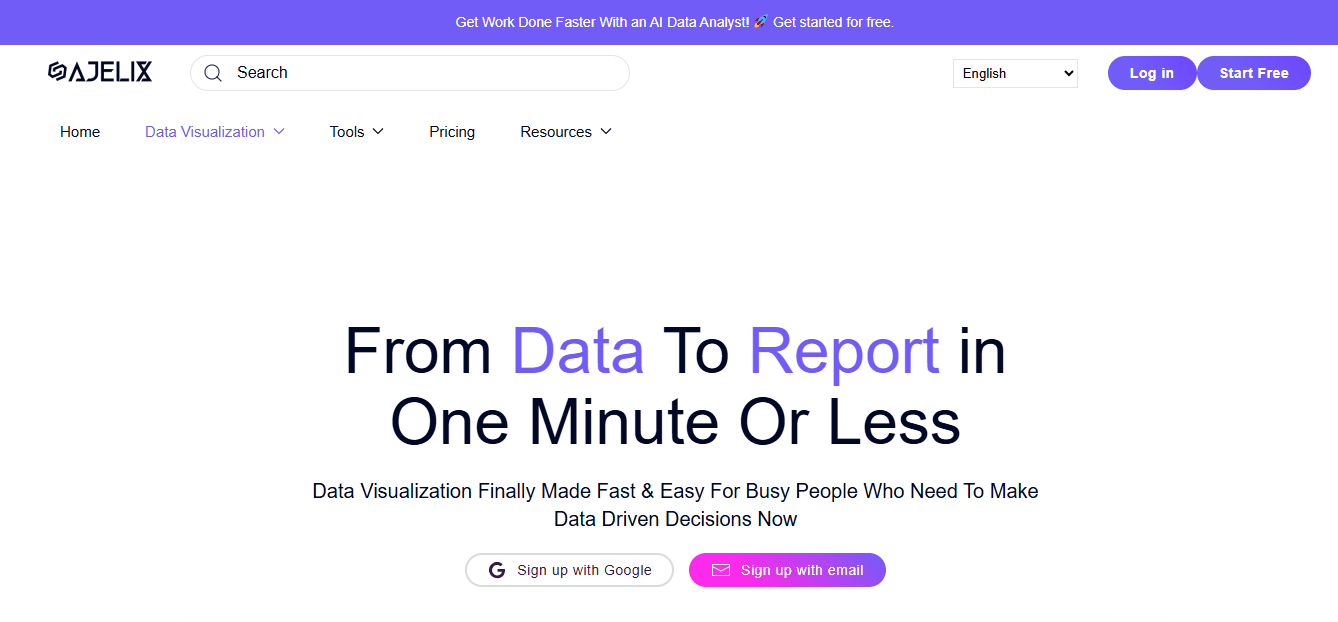
Ajelix BI is a business intelligence (BI) software that helps organizations extract actionable insights from their data. It uses advanced analytics, machine learning, and data visualization tools to support data-driven decisions, improve performance, and uncover growth opportunities. The software connects with multiple data sources such as ERP systems, CRM platforms, and cloud applications to provide a unified view of business performance. With its interactive dashboards and reports, users can analyze metrics like sales trends, customer behavior, and operational efficiency. Its predictive analytics feature enables businesses to forecast outcomes and prepare for market shifts.
Features
- Excel formula generator
- AI dashboard generator
- Data visualization tools
- Self-service business intelligence
- Multi-platform compatibility
Pros
- Simple, user-friendly editing with a no-code editor
- Data preparation, cleaning, and transformation tools
- Advanced analytics with data modeling
- AI-powered dashboard generator and chart builder
- Conversational analytics (chat with AI about data)
- Quick setup with no training required
Cons
- Heavy reliance on automation
- Possible integration challenges
Pricing (billed monthly)
- Pro – $20 per user/month
- Expert – $50 per user/month
- Business – $100 per user/month.
2. Klipfolio
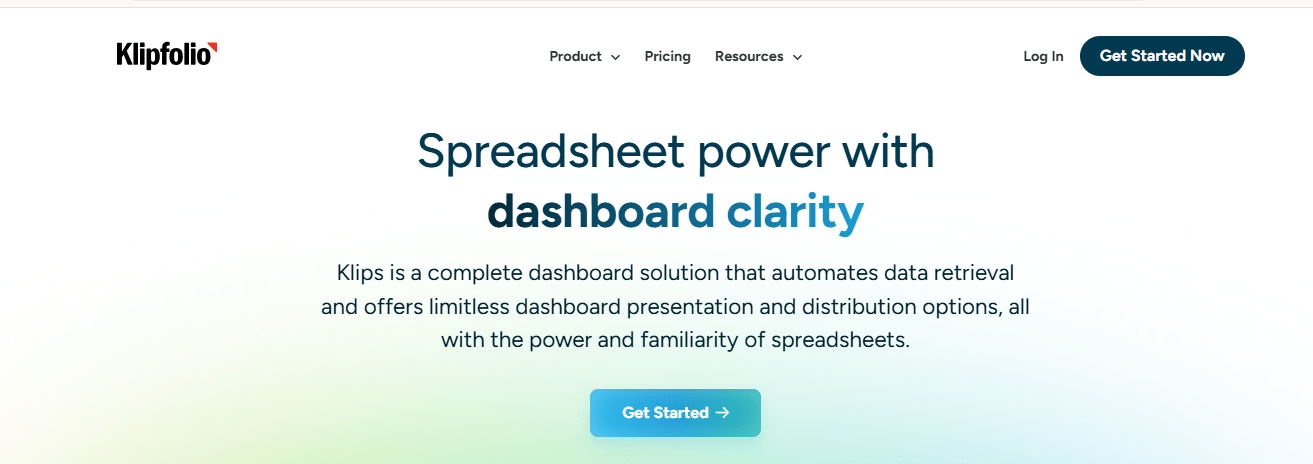
Klipfolio dashboards give businesses visibility into critical data and insights. The platform empowers teams to make informed, data-driven decisions and continuously improve performance. With Klipfolio BI Tool, users create precise, pixel-perfect dashboards and reports using cloud-based data. The tool stands out for its flexibility and user-friendly interface.
Features
- Connect to over 100 data sources, both online and on-premise, including Google Analytics, Salesforce, QuickBooks, cloud and on-premise databases, FTP servers, and local files.
- Combine and manipulate multiple data sources in the editor by writing formulas with Excel-like functions, mathematical operations, and statistics to build custom business metrics.
- Customize the design and layout of dashboards and visualizations, and deploy them via public or private links, or export as images and PDFs for sharing internally or externally.
Pros
- Connects data from more than 100 sources.
- Relatively easy setup for most integrations.
- Provides live reporting.
- Supports custom data feeds using SQL.
- Offers flexible sharing options.
Cons
- Experiences speed issues and occasional delays.
- Lacks a drag-and-drop interface, which complicates customization.
- Support materials are difficult to navigate and understand.
Pricing
Base:$120/month
Grow: $190/month
Team: $310/month
Team+: $600/month.
3. Power BI

Microsoft Power BI is a powerful business intelligence software that helps organizations turn raw data into meaningful insights.While data analysts often rely on it, Microsoft designed the platform so that even non-technical users can easily explore and understand data. With data visualization tools such as graphs, maps, charts, and scatter plots, Power BI allows users to present information in ways that drive better decision-making. Its AI Insights feature uses artificial intelligence to detect patterns, trends, and predictions within datasets.
Features
- User-friendly interface that lets users build custom visualizations quickly
- Compatibility with numerous data sources and large datasets
- Advanced analytics, including natural language queries and predictive modeling
- Multiple visualization formats, such as charts, maps, and graphs
Pros
- Supports a wide variety of data connections
- Uses DAX formulas for advanced calculations
- Integrates seamlessly with Microsoft’s ecosystem (Excel, Teams, Azure, etc.)
- Allows scheduled data refreshes
- Offers custom visualization options
- Provides a freemium plan
Cons
- Requires complex setup and knowledge of DAX functions for advanced use
- Lacks responsive design for mobile; users must create two reports for different devices
- Limited flexibility in sharing and permissions settings
Pricing
- Free Plan
- Power BI Pro – $14.00 per user/month
- Power BI Premium Per User – $24.00 per user/month
4. Domo
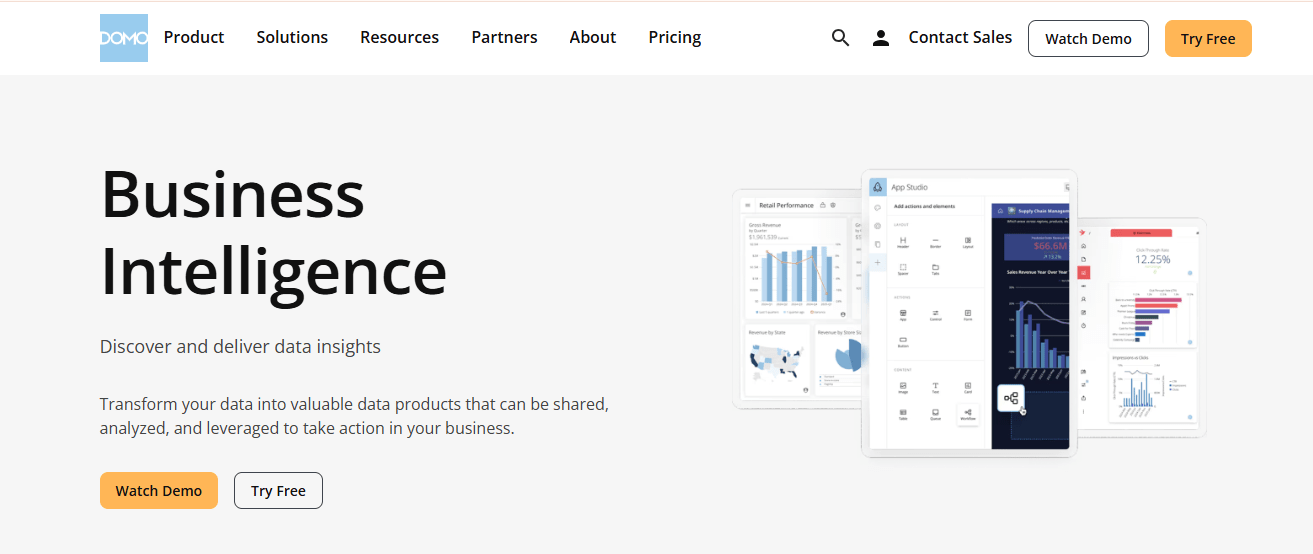
Domo collects data from any source and makes it available for the entire organization to access. The tool empowers users to discover and study information independently through self-service reporting and analytics. As a cloud-native platform, Domo increases the impact of analytics by involving everyone in the process. It moves beyond traditional BI by presenting data in dashboards and apps that make insights visible, actionable, and easy to understand, helping businesses improve operations at scale.
Features
- Intuitive drag-and-drop interface for building custom visualizations
- Advanced analytics, including predictive modeling and machine learning
- Capacity to handle large data sets and integrate with multiple systems
- Multiple visualization options such as charts, maps, and graphs
Pros
- Customizable user interface
- Out-of-the-box connectors that are simple to use
- Easy-to-build visualizations
Cons
- Customer support lacks technical expertise
- No ability to link data sets
Pricing
- Contact Domo for pricing details
5. The Qlik Analytics Platform
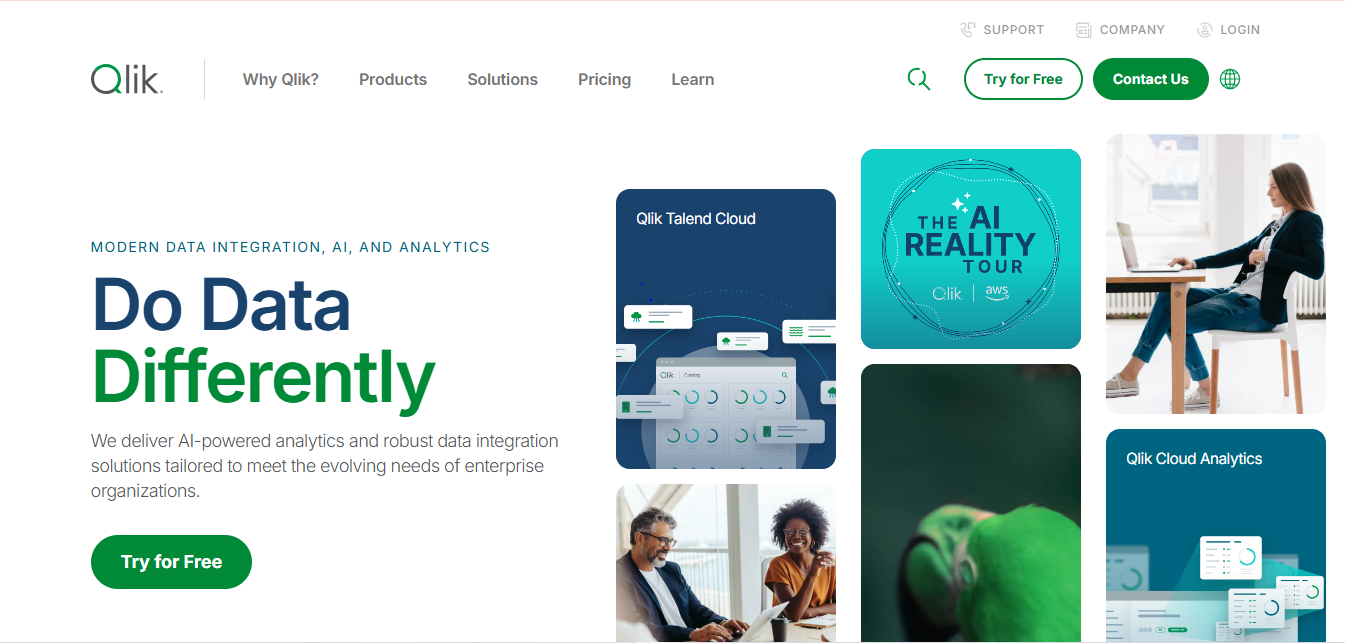
Qlik Sense is a self-service business intelligence (BI) tool that enables users to create and share interactive data visualizations, reports, and dashboards. With its drag-and-drop interface, non-technical users can explore data and uncover insights quickly. The platform supports multiple data sources and adapts to different business needs. Through the Qlik Analytics Platform, organizations can embed analytics and extend Qlik Sense across their enterprise.
Features
- Progressive creation tool that guides users in building data visualizations
- Centralized hub for accessing and sharing projects with others
- Capacity to handle large data sets and connect to multiple data systems
- Advanced analysis tools, including data blending and geo-analytics
Pros
- Active and supportive online community
- Quick to set up and begin using
- Straightforward for both administrators and end users
Cons
- Data integration depends on strong connectivity
- Higher-tier plans come at a steep cost
Pricing
- Contact vendor for pricing details
6. Looker
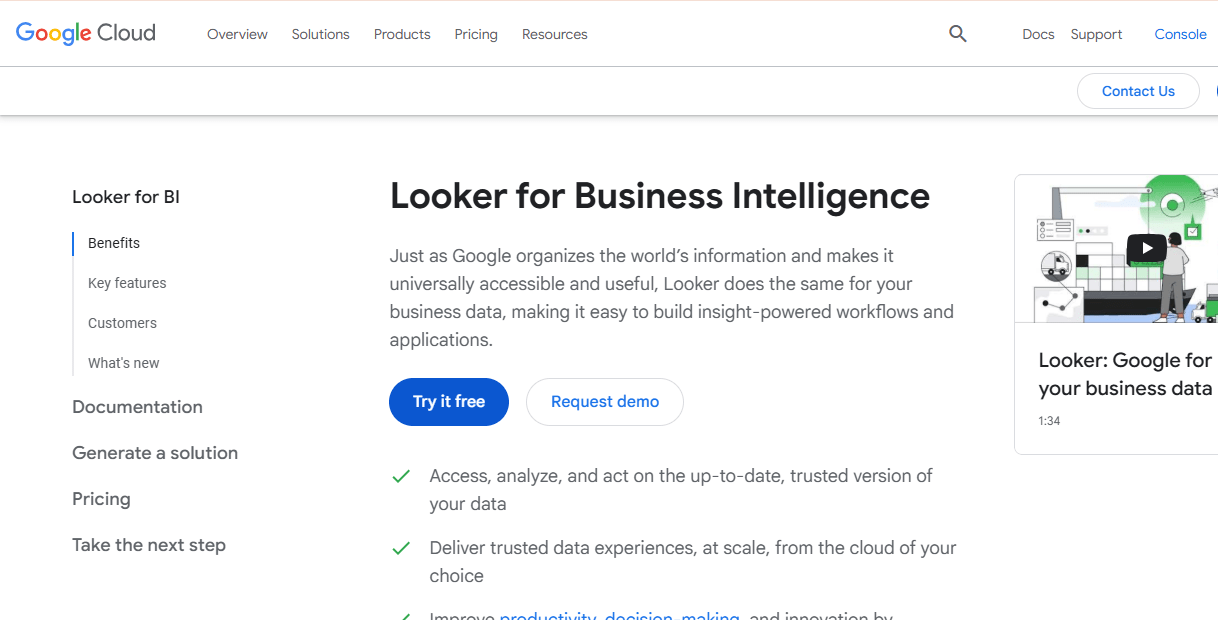
Looker, part of Google Cloud, is a business intelligence (BI) platform that gives end users an intuitive way to explore and analyze data. With its web-based interface, users can build and share reports that support insight-driven workflows across an organization. Looker serves as a self-service BI tool that helps both technical and non-technical users visualize and understand data effectively.
Features
- LookML allows data teams to create centralized, reusable data models.
- Users can build dashboards and reports without writing SQL.
- Interactive visualizations support real-time data exploration.
Pros
- Offers free tools.
- Provides intuitive navigation and learning process.
- Features a user-friendly design and interface.
Cons
- Provides support mostly through forums and FAQs.
- May show delayed performance with large data sets.
Pricing
- You need to request a quote for Looker pricing.
7. Zoho Analytics
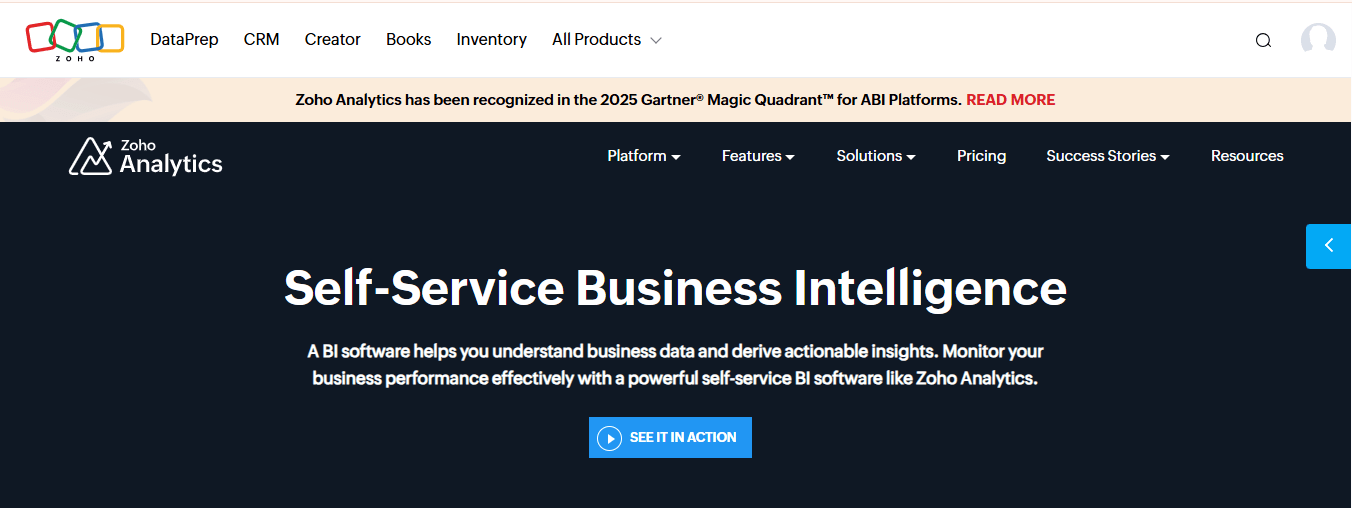
Zoho Analytics is a self-service business intelligence (BI) tool that helps businesses explore and visualize their data. Both technical and non-technical professionals can use it to extract insights and make informed decisions. Businesses of all sizes and industries can deploy Zoho Analytics either on the cloud or on-premise.
Features
- Connects to over 250 data sources, including cloud apps, databases, and spreadsheets
- Offers interactive visualizations with customizable charts, graphs, and widgets
- Provides AI-powered insights, predictive analytics, and natural language queries
- Supports collaboration with report sharing and threaded discussions
Pros
- Simple drag-and-drop interface
- Unified platform for data analysis and decision-making
- Extensive integrations with external applications
Cons
- Difficulties in merging multiple datasets into one report
- Limited customization for certain visual elements
- Possible performance issues with very large datasets
Pricing
- Basic: $30 per month
- Standard: $60 per month
- Premium: $145 per month
8. Tableau

Tableau from Salesforce is a leading business intelligence tool that transforms raw data into clear, interactive charts and graphs. It enables both beginners and advanced users to analyze data, uncover insights, solve complex problems, and make confident decisions. Available in both cloud and on-premises options, Tableau connects teams and builds a strong analytics culture.
Features
- Connects easily to multiple data sources
- Provides drag-and-drop functionality for quick visualizations
- Supports complex data blending across databases
- Enables real-time dashboard sharing and collaboration
Pros
- Simple transition for Excel users
- Handles large datasets effectively
- Improves team collaboration and communication
Cons
- Limited advanced analytics capabilities
- Requires IT support for complex deployments
Pricing
- Enterprise Creator: $115.00
- Enterprise Explorer: $70.00
- Enterprise Viewer: $35.00
9. ThoughtSpot
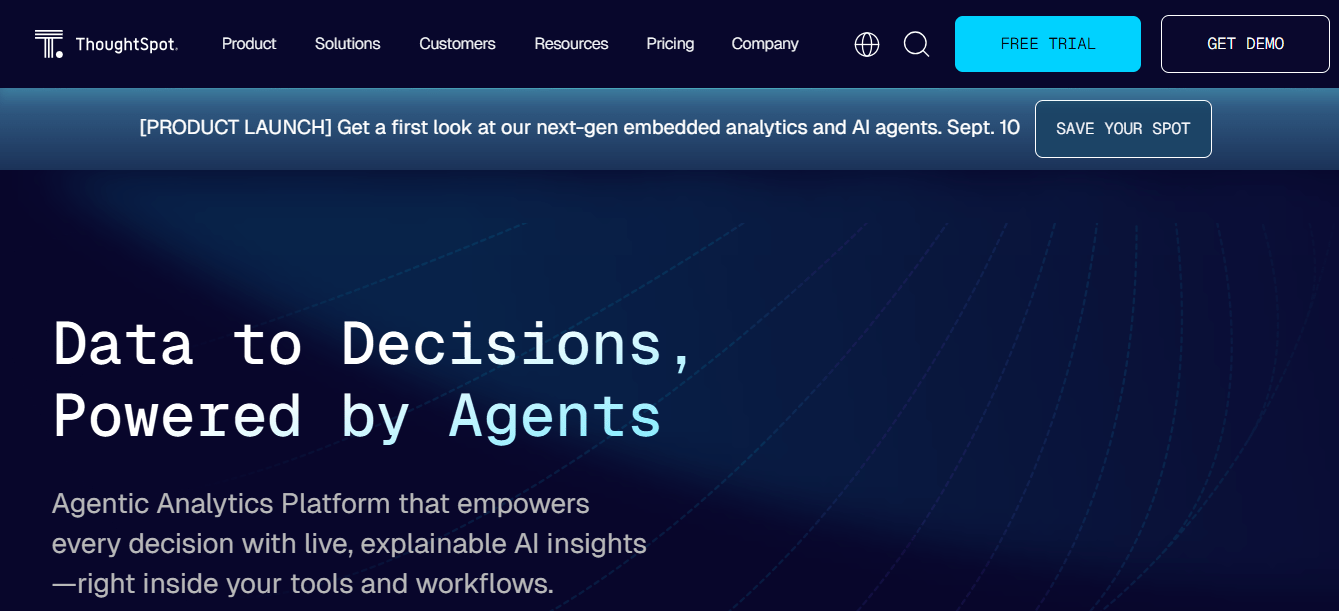
ThoughtSpot is a data analytics software that uses AI-driven search and visualization to help businesses analyze their data quickly. Users type questions in natural language and receive real-time insights, making analytics accessible even to non-technical teams. The platform connects with multiple data sources, including cloud storage, databases, and enterprise systems, to provide unified access to information.
Features
- Users ask data questions in natural language through a GenAI-powered search interface.
- Interactive Liveboards display personalized, real-time insights and visualizations.
- Businesses embed insights directly into their applications for easier workflows.
- AI-assisted data modeling detects trends, anomalies, and predicts future outcomes.
Pros
- Simple natural language query experience.
- Connects with multiple external tools.
- Offers advanced customization for charts and graphs.
Cons
- Costs rise significantly with high query volumes.
- Integration with some tools requires extra effort.
Pricing
Contact for pricing.
10. Sisense
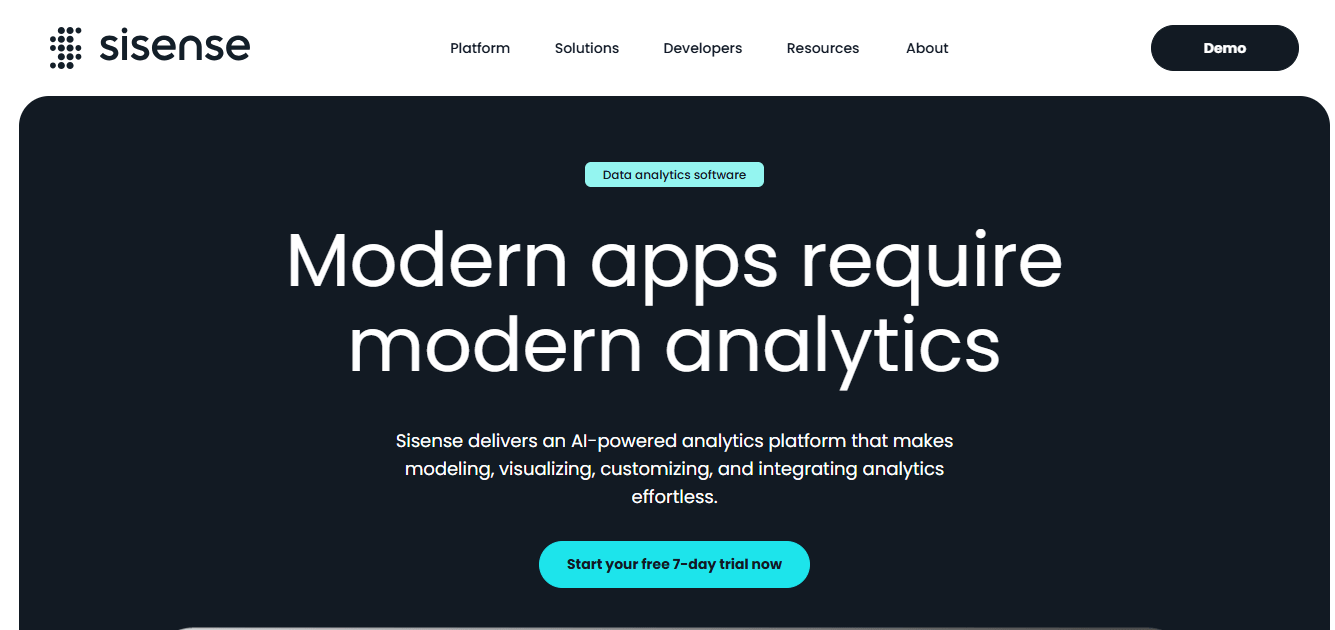
Sisense provides live data reporting through both desktop and web-based applications. The desktop application works across all operating systems, while the online editor offers different features from the desktop version. The platform combines data in a hybrid-cloud environment and makes it accessible through interactive dashboards, self-service analytics, and white-labeled BI applications. Sisense supports analytics and reporting for multiple business areas, including customer service, digital marketing, finance, human resources, retail and eCommerce, and IT operations.
Features
- Dashboard embedding
- Conversational analytics with AI
- Self-service platform
- Real-time data streaming
- Mobile BI
- Drag-and-drop interface
Pros
- Uses proprietary in-memory database technology, Elasticube, to efficiently handle and analyze large, complex datasets.
- Drag-and-drop interface that allows users to create dashboards and reports without advanced technical skills.
- Offers a variety of interactive charts, graphs, and dashboards for effective data visualization.
- Enables users to embed analytics directly into their own applications or websites for a unified experience.
Cons
- Advanced functions such as complex data modeling and scripting requires significant effort.
Pricing
- Contact vendor for pricing details.
The top 10 self-service BI solutions address different organizational needs. Microsoft Power BI offers cost-effective analytics and integrates well with Microsoft ecosystems, making it a strong choice for businesses already using Microsoft tools. Tableau leads in advanced data visualization, while Ajelix BI introduces AI-driven features and conversational analytics. Cloud-native platforms like Domo support growth with flexible scalability, and enterprise-ready solutions like Qlik Sense deliver reliability for large organizations.
When choosing a self-service BI tool, businesses must evaluate budget, existing technology infrastructure, user expertise, data source compatibility, and scalability.

